
Orange County Market Intelligence
Orange County Market Intelligence
September 28, 2026
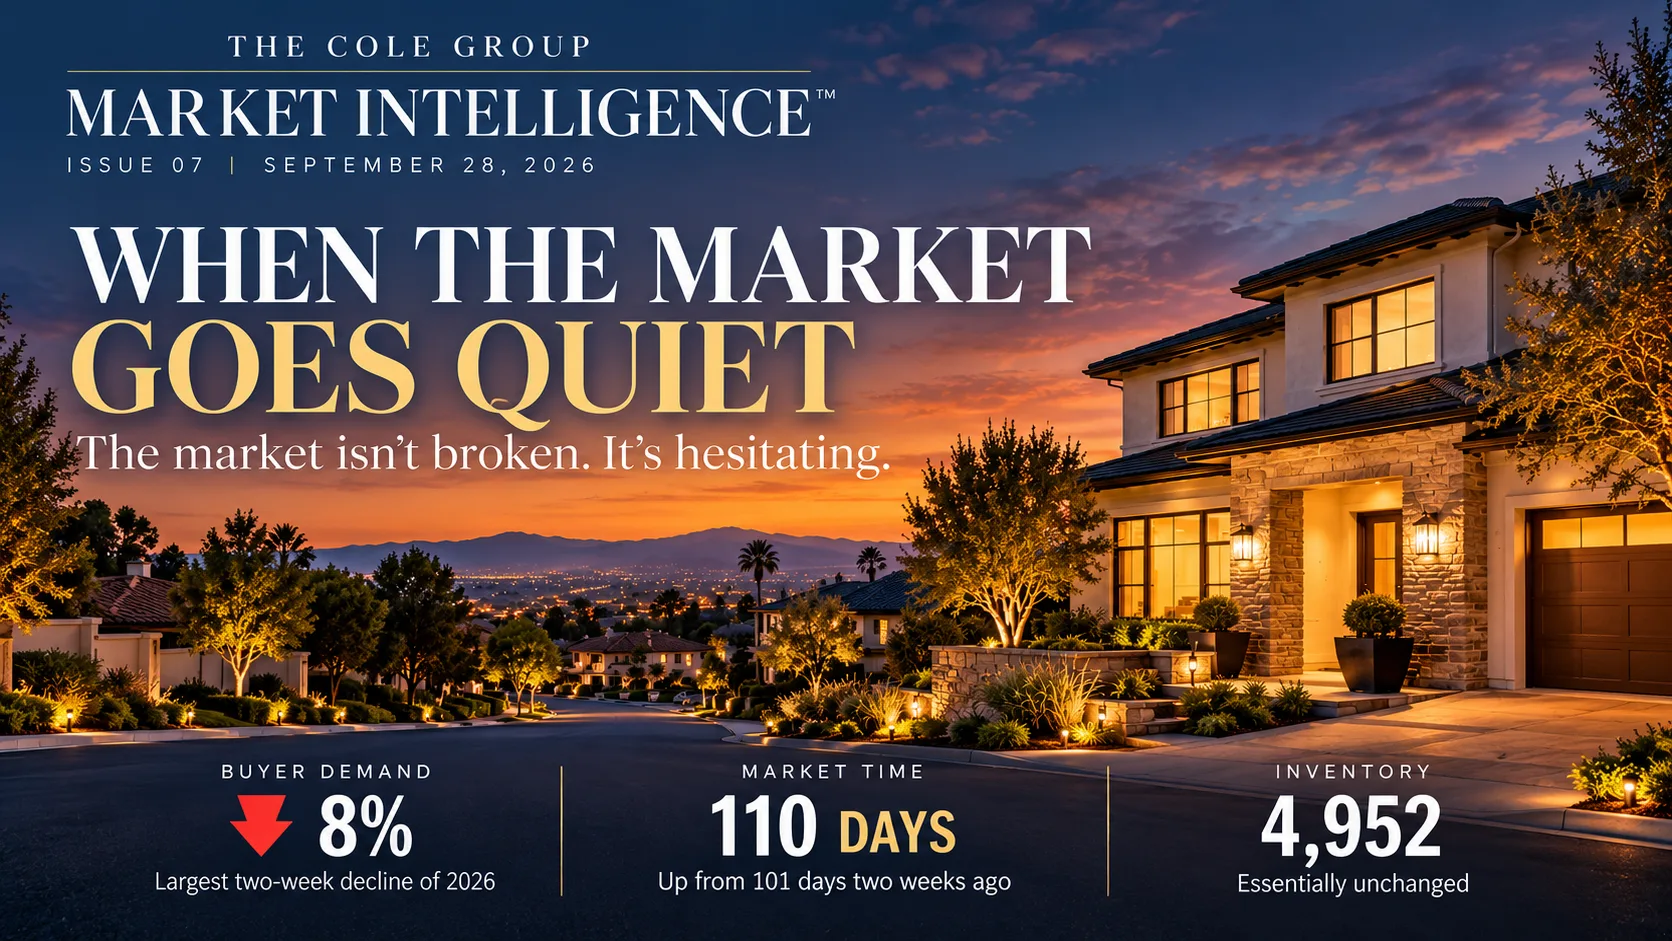
ISSUE #07WHEN THE MARKET GOES QUIET
The market isn't broken. It's hesitating.
Tap to expand
Orange County did not experience a meaningful increase in inventory. Buyer demand declined sharply, causing Expected Market Time to increase. The market is quieter primarily because fewer buyers are moving forward, not because the county suddenly became flooded with listings.
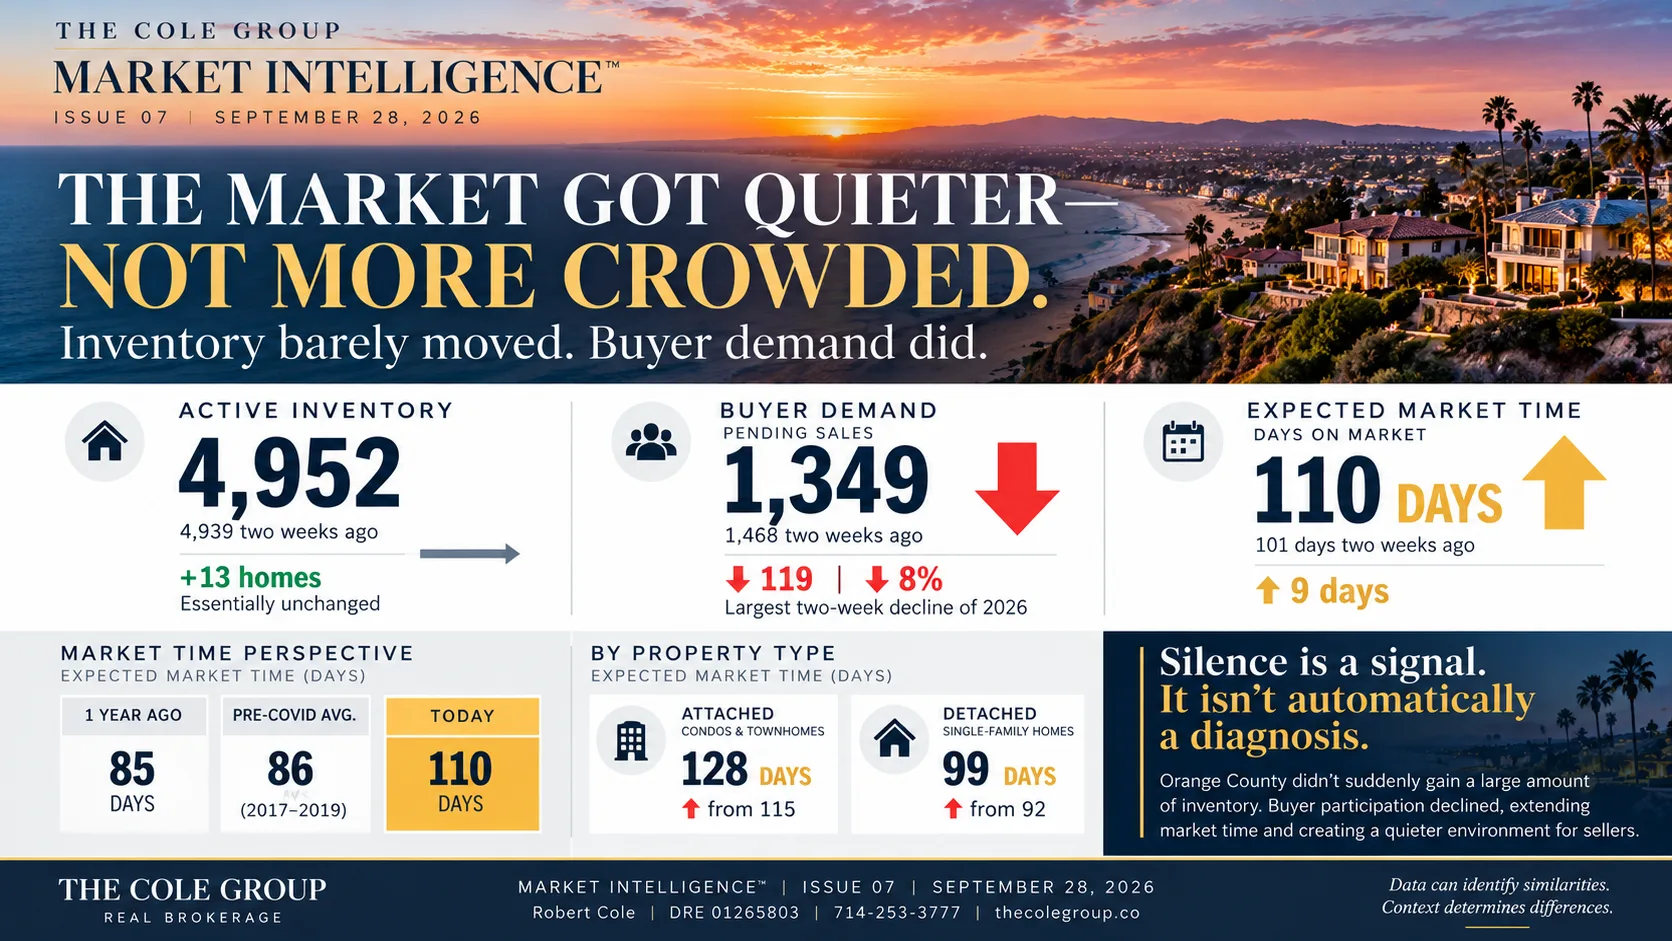
Active inventory stands at 4,952 homes, essentially flat from 4,939 two weeks ago. Buyer demand fell to 1,349 pending sales from 1,468, a decline of 119, or 8%. Expected Market Time rose to 110 days, up from 101 days two weeks ago and 85 days one year ago.
The market isn't broken. It's hesitating.
Silence is not the same thing as rejection.
Silence is a signal. It isn't automatically a diagnosis.
Don't confuse insufficient evidence with negative evidence.
The Market Intelligence Brief
Inventory barely moved. Buyer demand did.
THE MARKET GOT QUIETER—NOT MORE CROWDED
Orange County's Expected Market Time rose to 110 days, from 101 days two weeks ago and 85 days one year ago. But active inventory barely moved: 4,952 homes, essentially flat from 4,939 two weeks ago.
What changed was demand. Buyer demand fell to 1,349 pending sales from 1,468, a decline of 119, or 8%. Fewer buyers moved forward, and the market got quieter.
That distinction matters. Silence is a signal. It isn't automatically a diagnosis.
That's why the useful question isn't simply:
"Is the market slowing?"
It's:
"Is the market slowing because there are more homes, or because fewer buyers are moving forward?"
Four Signals We're Watching
Demand, Not Inventory
Active inventory barely moved. Buyer demand is what shifted.
Slower, Not Broken
The market isn't broken. It's hesitating.
Silence Is a Signal
Silence is a signal. It isn't automatically a diagnosis.
Evidence Over Assumption
Don't confuse insufficient evidence with negative evidence.
Silence is not the same thing as rejection.
Questions for Orange County
Q. Why did Expected Market Time increase if inventory barely moved?
A. Because buyer demand declined.
Active inventory stands at 4,952 homes, essentially flat from 4,939 two weeks ago. Buyer demand fell from 1,468 to 1,349 pending sales, a decline of 119, or 8%. With fewer buyers moving forward, Expected Market Time rose to 110 days, up from 101 days two weeks ago and 85 days one year ago.
Orange County did not experience a meaningful increase in inventory. The market is quieter primarily because fewer buyers are moving forward, not because the county suddenly became flooded with listings.
Q. Does a quieter market mean the market is broken?
A. No. The market isn't broken. It's hesitating.
Silence is not the same thing as rejection. Silence is a signal. It isn't automatically a diagnosis.
Don't confuse insufficient evidence with negative evidence. A quieter market asks for closer attention to what is actually changing, not for conclusions drawn from noise.
Q. Does property type change the picture?
A. Yes.
Attached homes currently have a 128-day Expected Market Time, compared with 99 days for detached homes.
A condominium buyer and a detached-home buyer can therefore encounter different competitive conditions despite operating in the same county.
ONE COUNTY. DIFFERENT CONVERSATIONS.
The countywide slowdown is real—but it isn't unfolding the same way in every local market or price segment.
| Market | Active | Demand | Expected Market Time | 2 Weeks Ago | 1 Year Ago |
|---|---|---|---|---|---|
| Orange County | 4,952 | 1,349 | 110 days | 101 | 85 |
| Fullerton | 131 | 60 | 66 days | 65 | 61 |
| Brea | 47 | 20 | 71 days | 77 | 76 |
| Placentia | 76 | 19 | 120 days | 129 | 53 |
| Yorba Linda | 137 | 45 | 91 days | 85 | 72 |
| Luxury Market >$2.5M | 981 | 160 | 184 days | 157 | 187 |
That nearly two-month spread between Fullerton and Placentia demonstrates why countywide statistics establish context rather than dictate strategy.
Fullerton
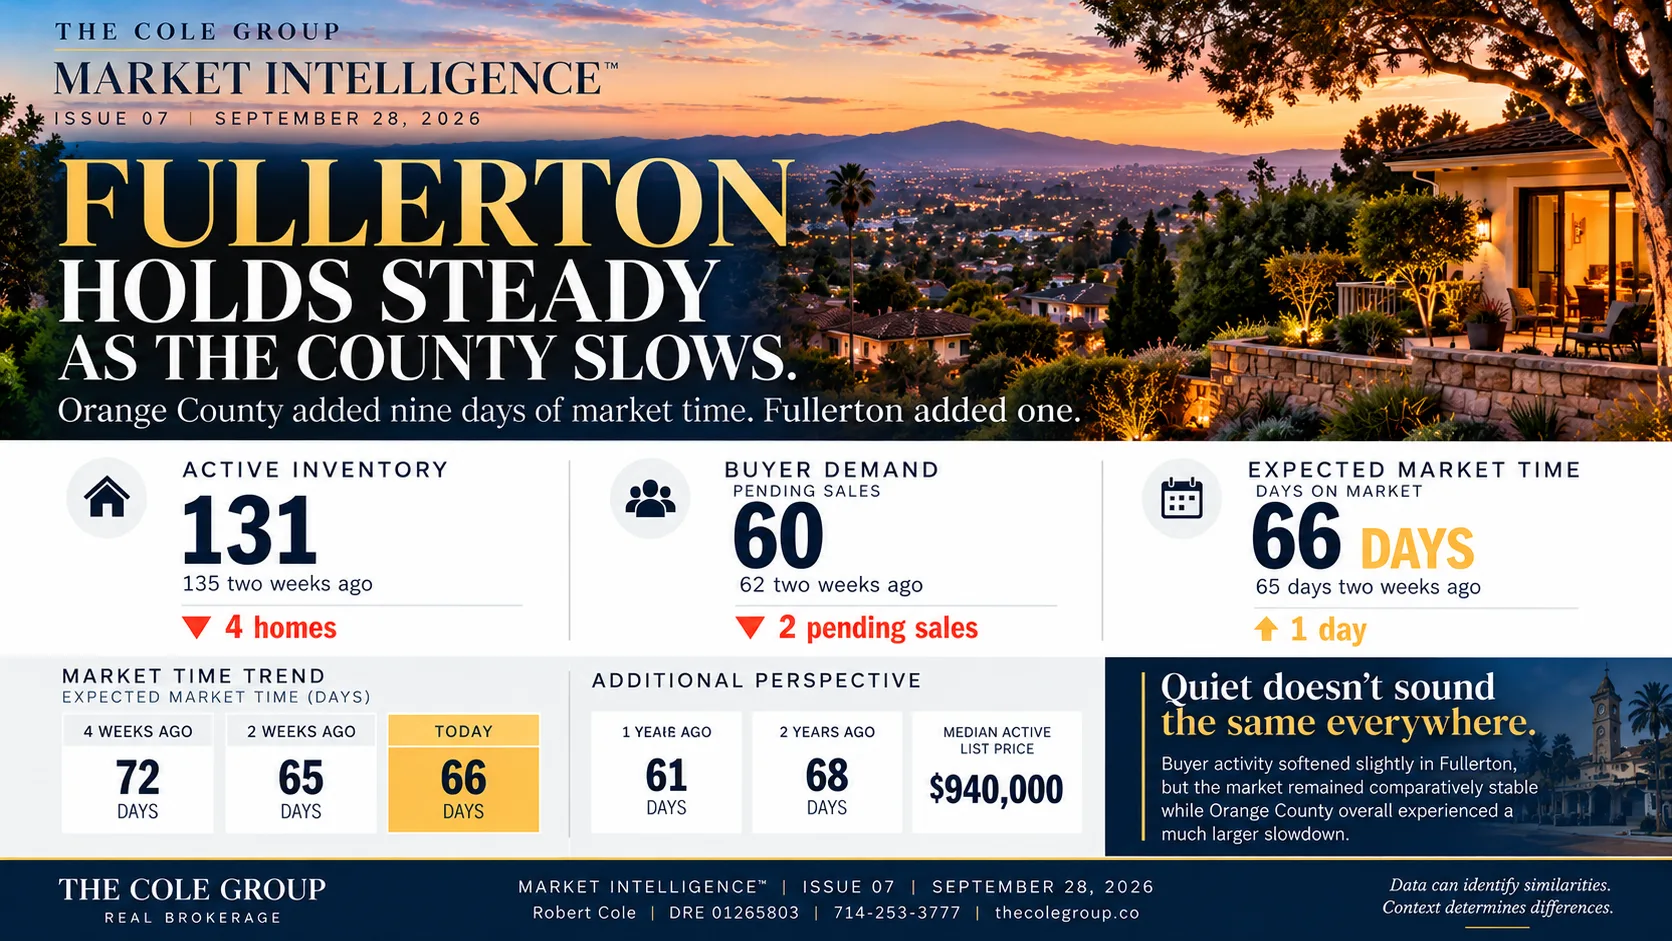
FULLERTON HOLDS STEADY AS THE COUNTY SLOWS
Tap to expand
FULLERTON HOLDS STEADY AS THE COUNTY SLOWS
Orange County added nine days of market time. Fullerton added one.
Fullerton's 131 active listings and 60 in demand produce a 66-day Expected Market Time, up from 65 days two weeks ago and 61 days one year ago.
A countywide slowdown does not mean every local market is slowing at the same time or speed.
Brea — Direction Matters
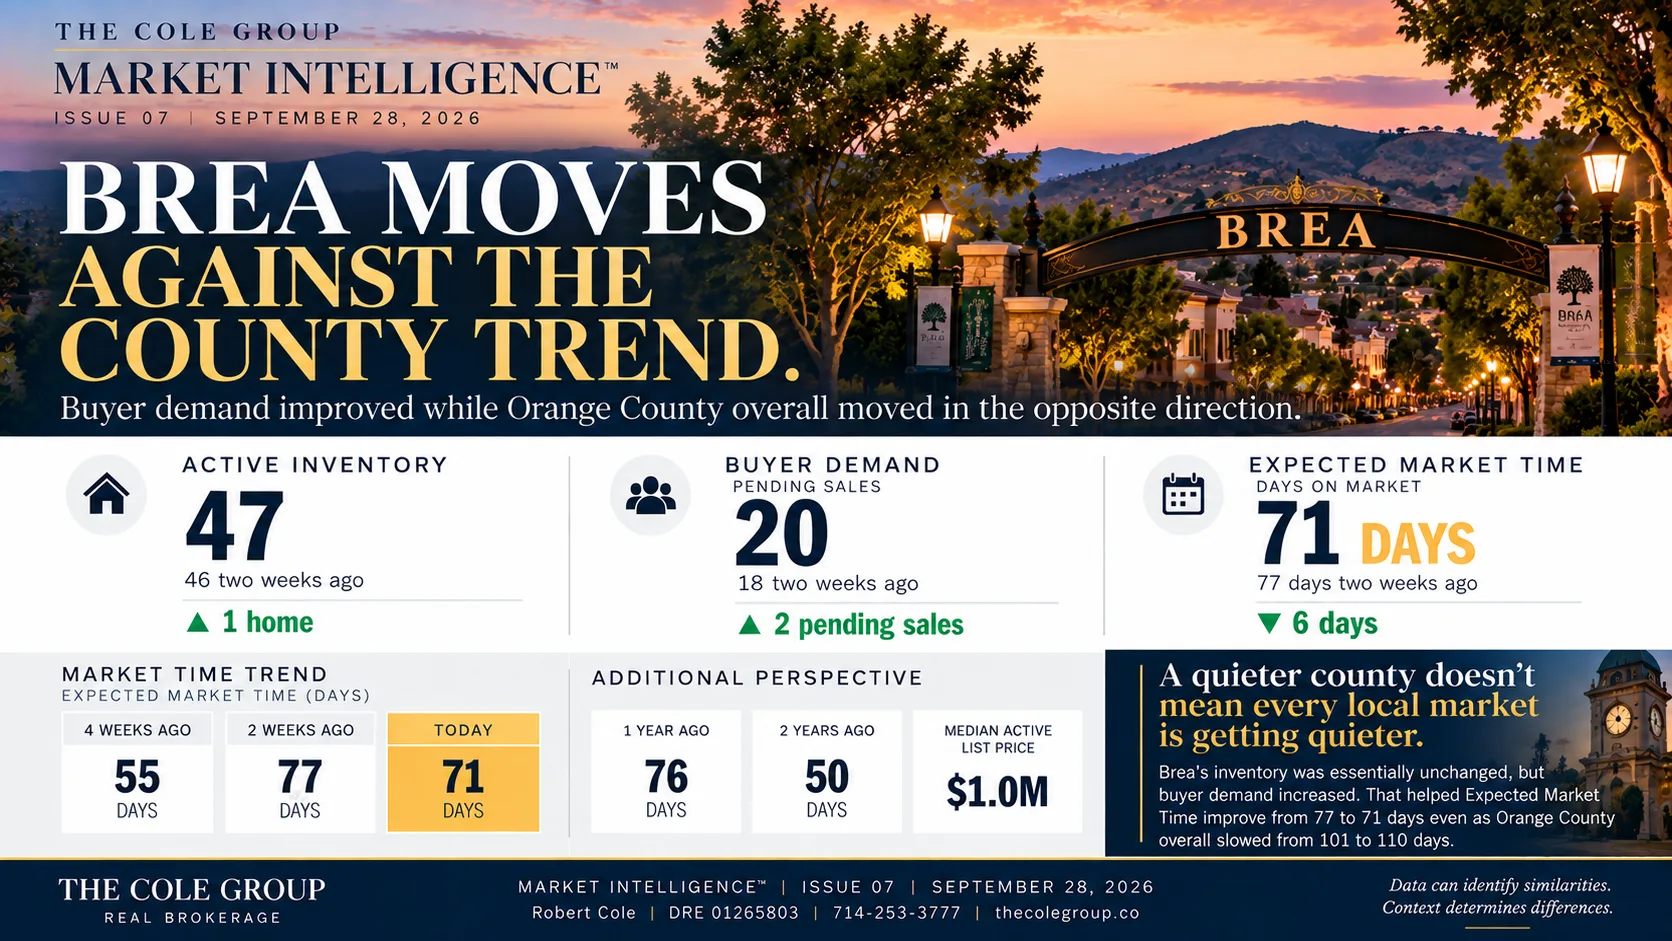
Brea has 47 active listings, 20 in demand and a 71-day Expected Market Time, down from 77 days two weeks ago.
Brea
BREA MOVES AGAINST THE COUNTY TREND
Tap to expand
BREA MOVES AGAINST THE COUNTY TREND
Buyer demand improved while Orange County overall moved in the opposite direction.
Brea has 47 active listings and 20 in demand, producing a 71-day Expected Market Time, down from 77 days two weeks ago and 76 days one year ago.
The number tells us where the market is. The trend helps tell us how it got there.
Placentia — The Other Side of the Average
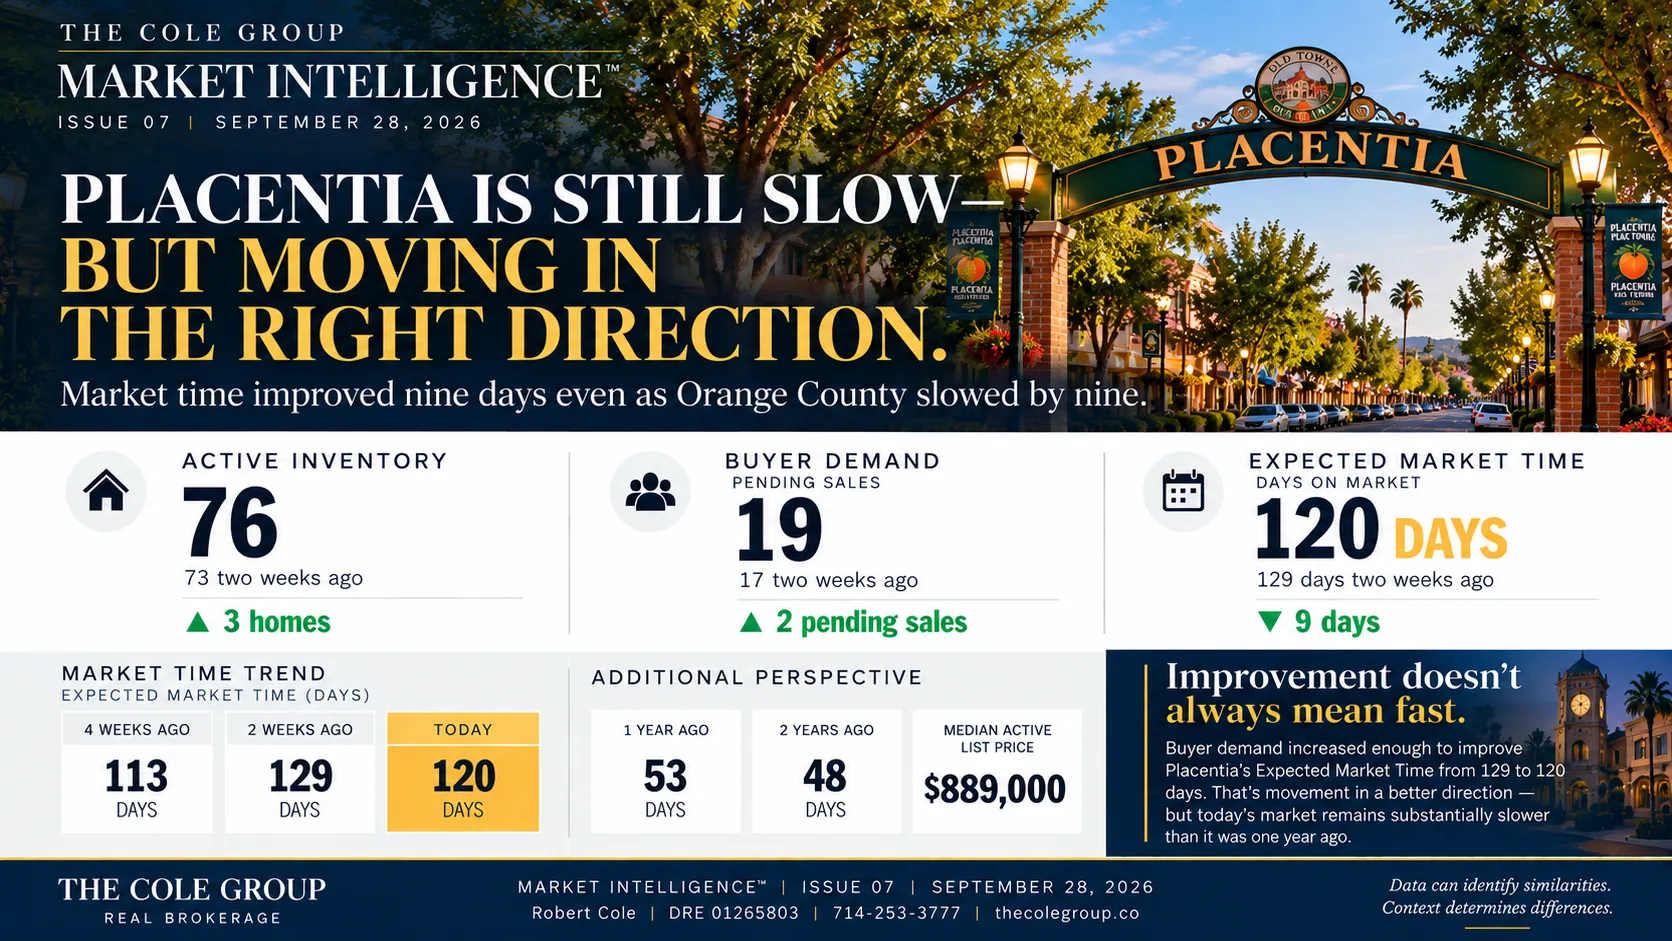
Placentia has 76 active listings and 19 in demand, producing a 120-day Expected Market Time, down from 129 days two weeks ago.
Placentia
PLACENTIA IS STILL SLOW—BUT MOVING IN THE RIGHT DIRECTION
Tap to expand
PLACENTIA IS STILL SLOW—BUT MOVING IN THE RIGHT DIRECTION
Market time improved nine days even as Orange County slowed by nine.
Placentia has 76 active listings and 19 in demand, producing a 120-day Expected Market Time, down from 129 days two weeks ago and 53 days one year ago.
Even 120 days, however, is a citywide measure—not a prediction for every Placentia property.
Yorba Linda — Slower Than Itself
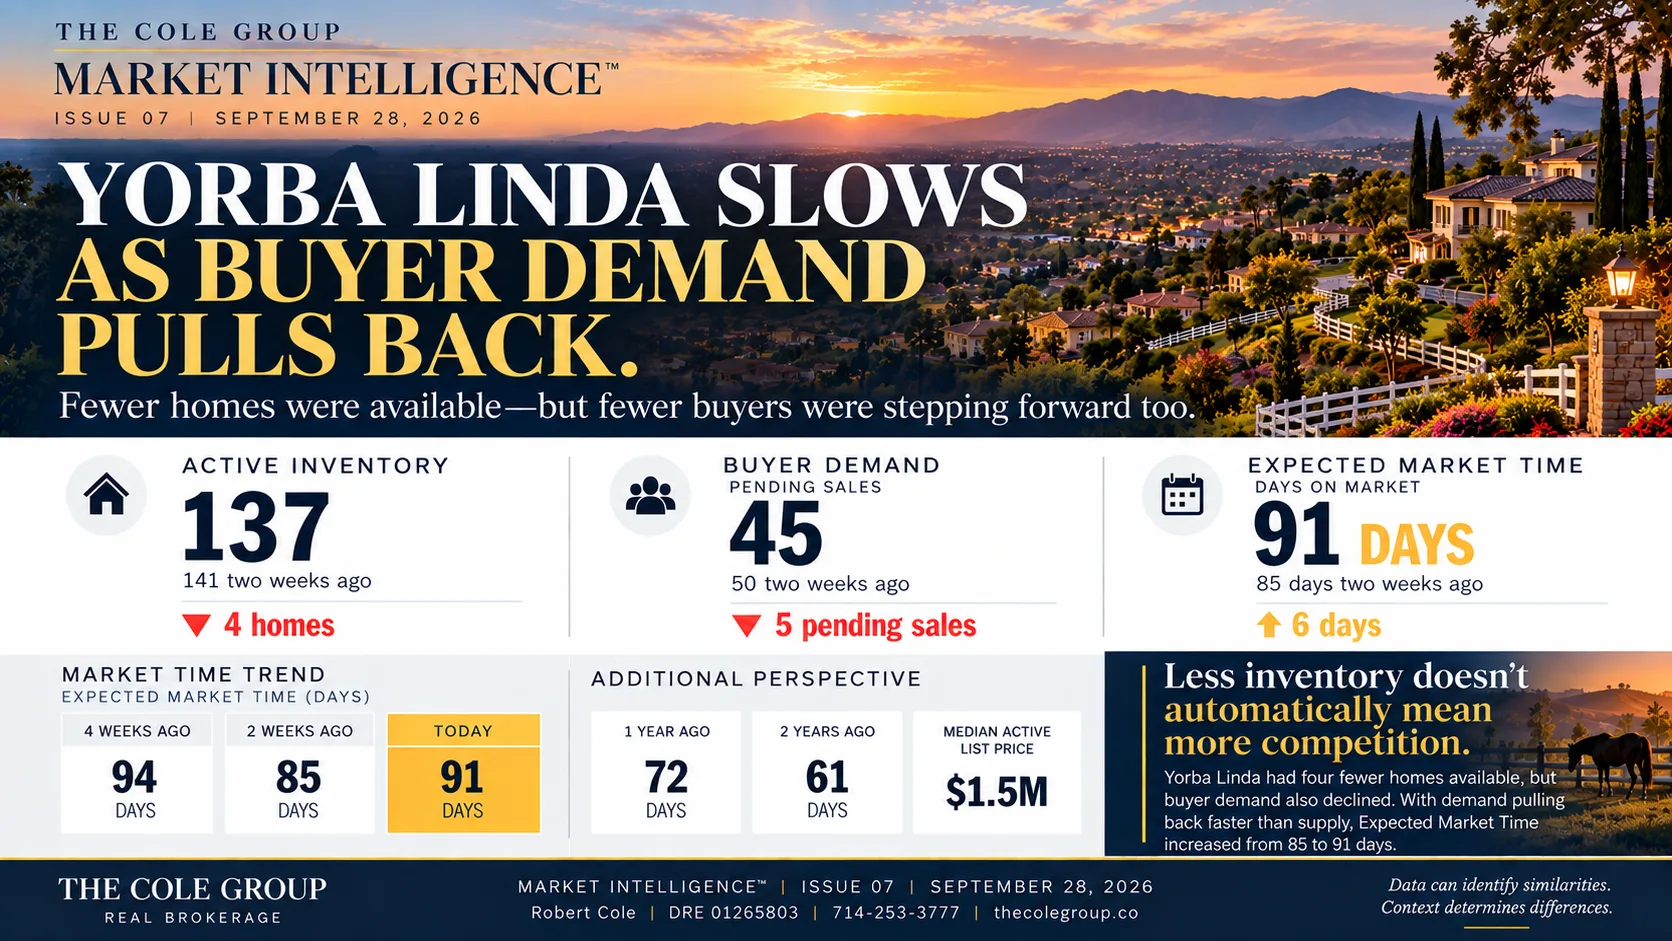
Yorba Linda has 137 active listings and 45 in demand, producing a 91-day Expected Market Time, up from 85 days two weeks ago.
Yorba Linda
YORBA LINDA SLOWS AS BUYER DEMAND PULLS BACK
Tap to expand
YORBA LINDA SLOWS AS BUYER DEMAND PULLS BACK
Fewer homes were available—but fewer buyers were stepping forward too.
Yorba Linda has 137 active listings and 45 in demand, producing a 91-day Expected Market Time, up from 85 days two weeks ago and 72 days one year ago.
Yorba Linda can therefore be slowing relative to its own recent history even as its market time remains faster than the county overall.
What These Four Cities Tell Us
Same county. Same broad economic backdrop. Four different market speeds.
Orange County establishes the environment. The city narrows the competitive field. The neighborhood narrows it further. The individual property determines the actual strategic position.
Luxury Market Intelligence
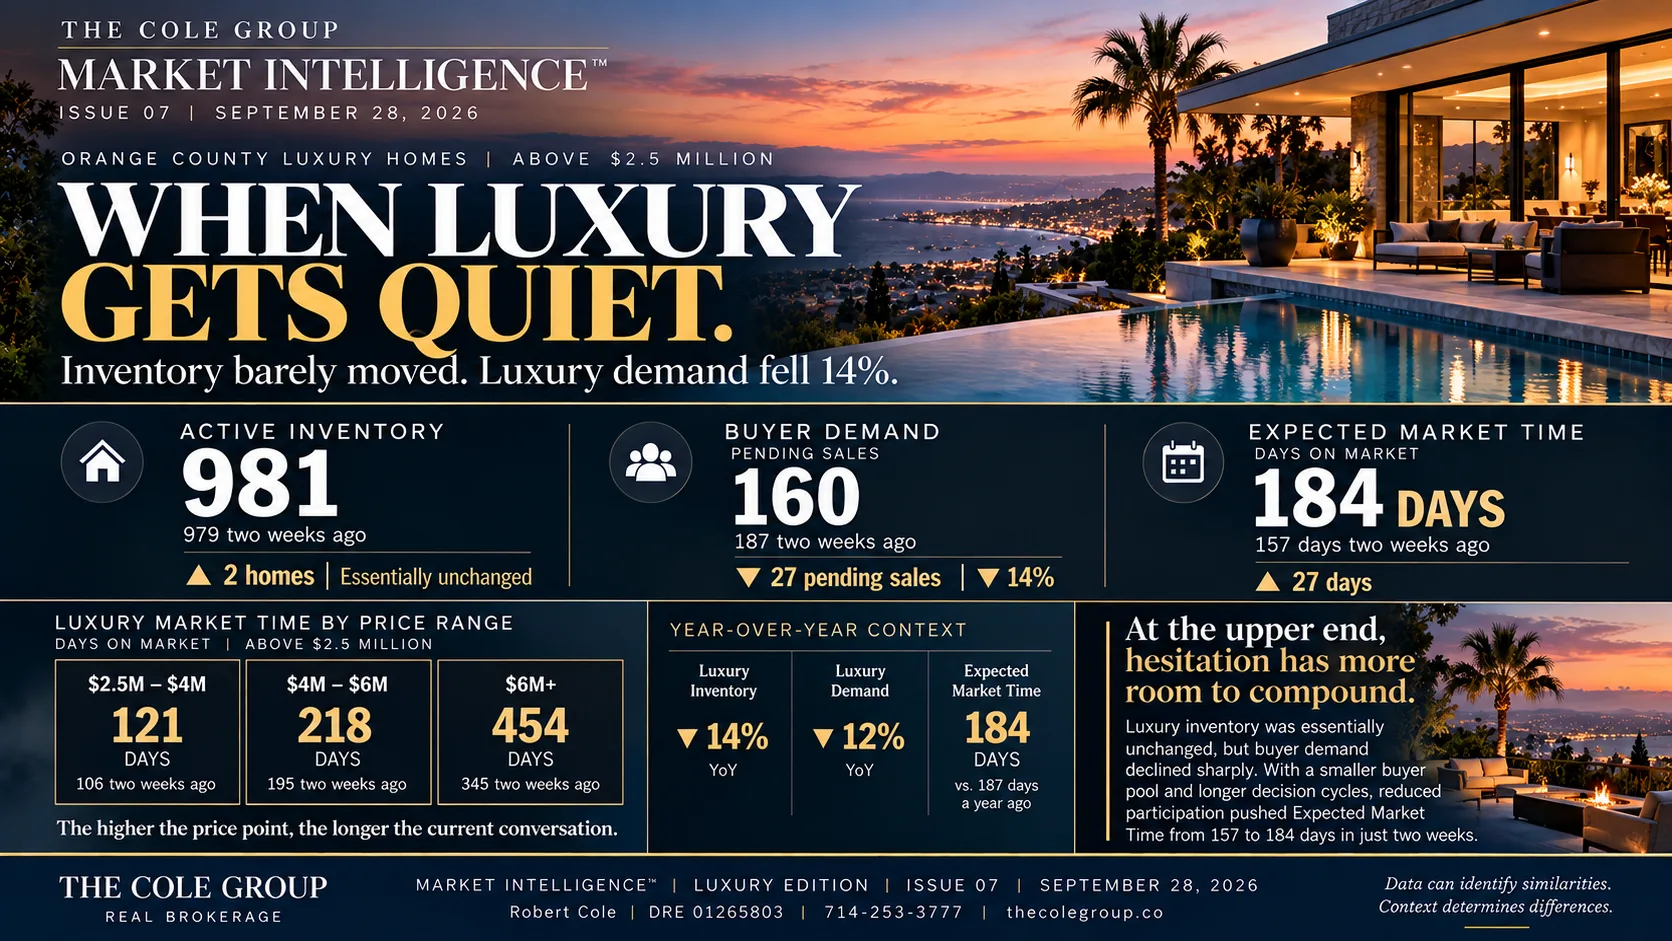
Inventory barely moved. Luxury demand fell 14%.
Orange County homes priced above $2.5 million
Tap to expand
WHEN LUXURY GETS QUIET
Luxury reinforces the same lesson at a different price point.
Orange County currently has 981 active luxury listings and 160 in demand, producing a 184-day Expected Market Time.
Over the past two weeks, inventory barely moved, from 979 to 981 listings, while demand fell from 187 to 160, a decline of 27, or 14%. Expected Market Time rose from 157 days to 184.
The market isn't broken. It's hesitating. When luxury gets quiet, the same distinction applies: inventory barely moved. Luxury demand fell 14%.
Does luxury give buyers more negotiating leverage?
Longer market times can create opportunities, but luxury requires even more property-specific analysis.
| Luxury Price Range | Expected Market Time |
|---|---|
| $2.5M–$4M | 121 days |
| $4M–$6M | 218 days |
| $6M+ | 454 days |
A $2.8 million property and a $7 million estate may both be called luxury, but they're not operating in equivalent markets.
At higher price points, buyer pools narrow and properties become less interchangeable. Longer exposure can therefore be part of the normal transaction cycle rather than evidence by itself that something is wrong.
The useful question isn't simply "How long has it been listed?"
It's:
"Why has this particular property been listed this long?"
Longer exposure may create leverage. Understanding why the exposure exists tells us whether that leverage is actionable.
Luxury changes the clock, but not the principle.
August 2026 Sold Report
Latest finalized Orange County closed-sales report
What Actually Happened at the Closing Table?
Current Market Intelligence tells us how conditions are developing. The Monthly Sold Report looks backward at completed transactions to see where buyers and sellers actually reached agreement.
August makes one thing increasingly clear:
The market is negotiating.
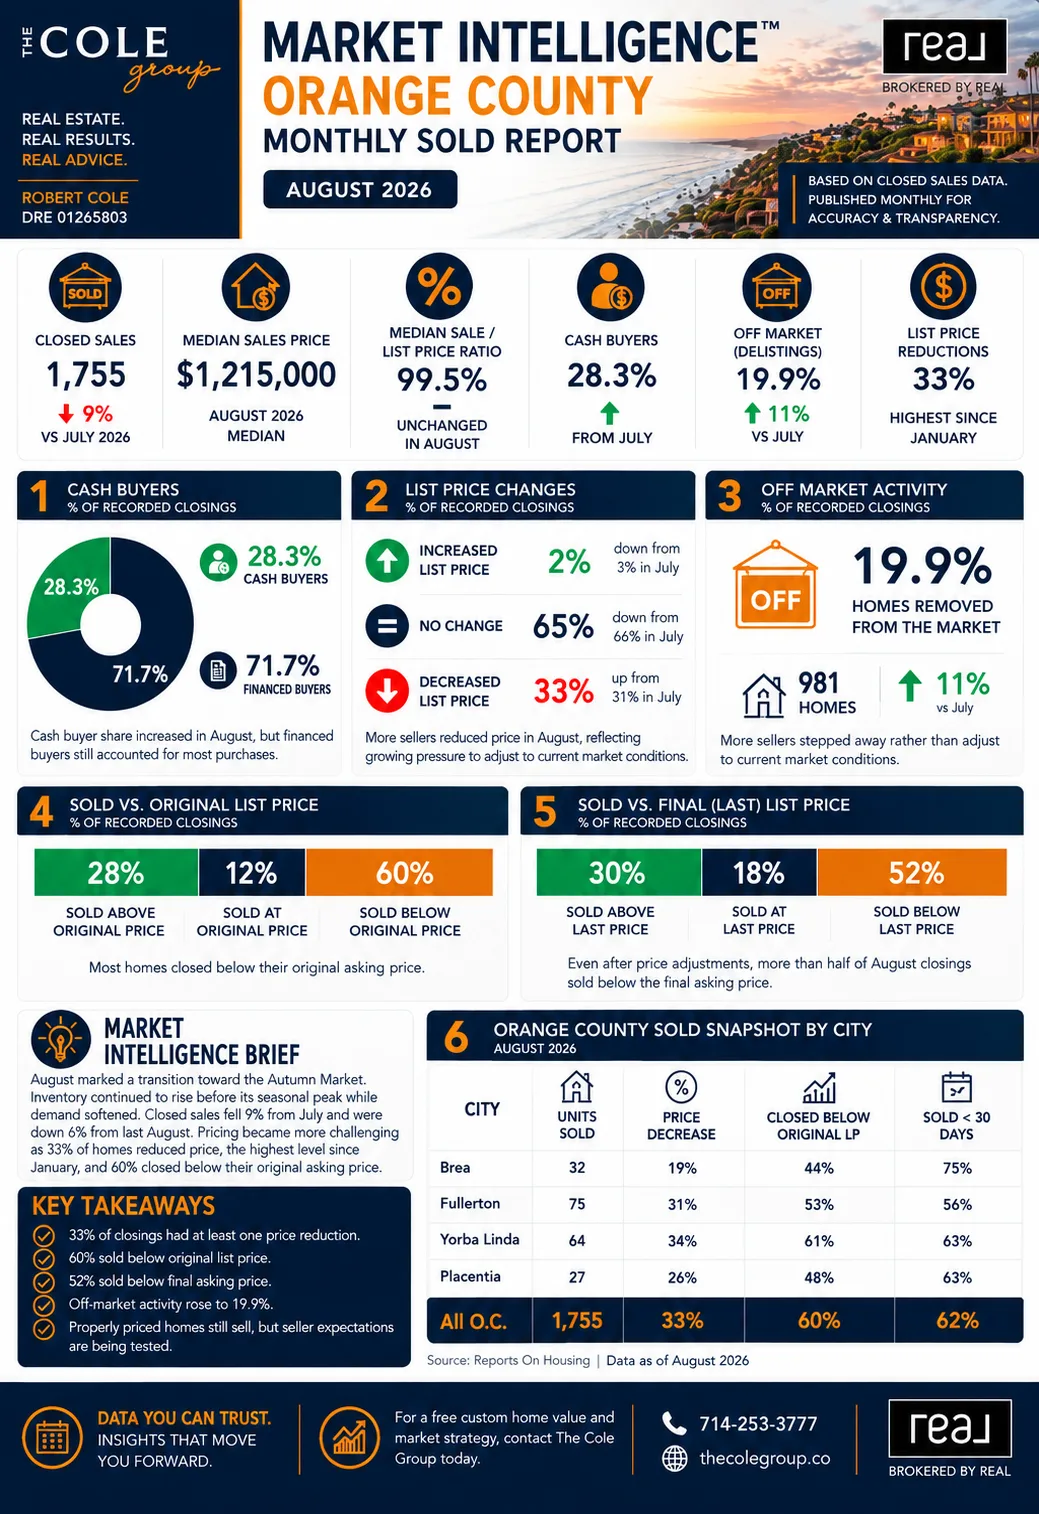
Orange County recorded 1,755 closed residential sales in August, with a $1.215 million median sale price and a 99.5% median sale-to-list ratio. Closed sales fell 9% from July and were 6% below August 2025.
But the more revealing story is not simply how many homes sold.
It is how they sold.
Sellers Are Adjusting More Often
33% of August closings had experienced a list-price reduction, up from 31% in July and the highest level since January.
Another 65% closed without a list-price change, while only 2% experienced an increase in asking price.
That does not mean every seller needs to reduce their price.
It does mean the market is becoming less forgiving when the initial position does not connect with buyers.
Sold vs. Original Asking Price
- 28% sold above the original asking price.
- 12% sold at the original asking price.
- 60% sold below the original asking price.
For six out of every ten August closings, the final agreement came in below where the property originally entered the market.
That makes the opening price important—but it also shows why the market's response after launch matters.
Sold vs. Final Asking Price
After sellers made whatever adjustments were necessary:
- 30% sold above the final asking price.
- 18% sold at the final asking price.
- 52% sold below the final asking price.
That means 48% of August transactions still closed at or above the seller's final asking price.
A slower, more negotiable market should not be confused with a market in which every buyer automatically receives a discount. The individual property still matters.
Some Sellers Chose Not to Sell
August also recorded 981 homes pulled from the market, representing 19.9% of active inventory. That was an 11% increase from July.
Not every seller responded to changing conditions by lowering the price and completing a sale. Some chose to step away instead.
That creates another form of negotiation occurring beneath the headline numbers:
the negotiation between what a seller wants and what the current market is willing to support.
What the Sold Report Adds to the Playbook
An asking price is a position.
A price reduction is a response.
A closed sale is the evidence of where a buyer and seller ultimately agreed.
August's data shows more sellers adjusting, more transactions finishing below their original asking price, and more owners deciding not to sell at all.
But it also shows that nearly half of completed transactions still finished at or above the final asking price.
The lesson is not simply that buyers have leverage or sellers have lost it.
It is that leverage is becoming increasingly property-specific.
The next transaction will not be determined by the Orange County average. It will be determined by how that particular home is positioned against the alternatives buyers can choose from today.
Data source: Reports On Housing | August 2026 finalized closed-sales data
Data source: ReportsOnHousing.com | Updated September 28, 2026
What This Means for You
Homeowner
A slower Orange County market does not automatically mean your home's value has fallen or that you need to do anything differently.
It means the competitive environment around your property deserves closer attention.
The most useful comparison isn't simply "Orange County." It's the group of properties today's buyers would realistically consider instead of yours.
Buyer
You generally have more time and choice than buyers had in faster recent markets, and some properties may offer meaningful negotiating opportunities.
The key is identifying where the leverage actually exists.
Look beyond asking price. Examine days on market, pricing history, competing inventory, recent pendings, condition and current buyer activity.
Don't negotiate simply because the market is slower. Negotiate based on the evidence surrounding the property.
Deciding Whether to List
Today's market places greater importance on decisions made before and immediately after launch.
Pricing, preparation, presentation and understanding the property's competitive set matter because buyers have more alternatives and more time to compare them.
But slower does not automatically mean weak. August's closing data shows 48% of Orange County transactions still finished at or above the seller's final asking price, with those properties recording a median market time of only nine days.
The objective isn't simply to price low or wait longer.
It's to understand how the property is positioned relative to the choices buyers have right now—and respond to the evidence the market provides.
AI and AVM's Reliability
Carefully reviewing all recent comparable closed and pending sales is the only way to establish price accurately.
While AI and Automated Valuation Models (AVMs) like Zillow's "Zestimate" can process vast amounts of data, they often fail to capture the true "Fair Market Value" of a home. The 1936 Literary Digest poll (which had massive amounts of data but still failed to predict the election result) is a reminder that volume of data does not guarantee accuracy.
For Sellers
Caution homeowners against placing too much confidence in AVMs or AI chatbots to determine their home's value. These tools should only serve as a "starting point" for a conversation with a real estate professional, rather than an accurate appraisal.
What the Data Says
Zillow itself acknowledges its "Zestimate" is a "transparent, free starting point" and explicitly states it is "not an appraisal and can't be used in place of an appraisal."
Zillow's accuracy improves significantly only after a home is listed, as the model then incorporates the listing price and description into its calculation.
Google's Gemini chatbot also admits that generalized AI models are not inherently better than specialized systems like Zillow's Zestimate, which has been trained for two decades specifically for real estate valuation.
For Buyers
Buyers should be skeptical of using automated estimates as an accurate reflection of a home's worth. Relying on them before they are recalculated (often after a listing price is set) can lead to inaccurate valuations.
Want an accurate valuation for your home based on real comparable data? Request a personalized report from Rob Cole or schedule a strategy call .
Frequently Asked Questions
Real answers to the most common questions about home valuations, automated estimates, and how to know what your property is really worth.
Q. Can I trust Zillow's Zestimate to price my home?
No. Zillow itself calls the Zestimate a "transparent, free starting point" — not an appraisal. The model only improves after a home is listed because it then incorporates the listing price and description. Before that, it's working off incomplete data.
Q. Why do AI home valuations miss the mark?
AI and Automated Valuation Models process large volumes of data, but volume doesn't equal accuracy. The 1936 Literary Digest poll had massive data and still got the election wrong. Home valuation requires reviewing recent comparable closed and pending sales — something algorithms often oversimplify.
Q. How do I know what my home is really worth?
The only reliable way to establish price is by carefully reviewing all recent comparable closed and pending sales in your area. A local real estate professional who knows your neighborhood's nuances — condition, upgrades, lot characteristics, street appeal — sees what algorithms miss.
Q. Should buyers rely on automated estimates when making an offer?
Buyers should be cautious. Automated estimates are often recalculated after a listing price is set, meaning the number you see today may not reflect the home's true market value. Relying on them before that recalculation can lead to overpaying or missing a fair deal.
Q. What does a real estate professional see that algorithms don't?
An experienced agent evaluates condition, layout, deferred maintenance, neighborhood micro-trends, buyer psychology, and recent comparable sales in context. These qualitative factors don't show up in any dataset — and they often make the difference between a home that sells and one that sits.
Still have questions about your home's value? Book a free strategy call with Rob Cole for a straight answer based on real market data.
What Is Your Home Worth?
Generic online estimates miss the details that matter in our hillside market — view premiums, lot position, school district micro-boundaries, and current absorption rates. Rob Cole delivers a localized, accurate valuation based on real comparable data from your specific Fullerton Hills neighborhood.

Understanding Market Data
Market reports are only useful when you understand what the metrics mean. Here's a quick reference for the key indicators used throughout this page, so you can interpret the data with confidence.
Days on Market
Measures how long it typically takes for a home to go from active listing to pending sale. Lower numbers indicate a faster-moving market where demand outpaces supply. In North Fullerton's hillside neighborhoods, this metric can vary significantly by price point and view orientation.
Sale-to-List Ratio
Shows the relationship between a home's final sale price and its original list price. Above 100% means homes are selling above asking; below 100% means sellers are accepting less. This ratio reveals how accurately homes are being priced relative to buyer expectations.
Active Inventory
Represents the total number of homes currently available for purchase. Rising inventory can signal a shift toward buyers, giving them more choices and negotiating leverage. Declining inventory favors sellers, often leading to competitive offers and faster sales.
Pending Sales (Demand)
Tracks the number of homes under contract but not yet closed. It's a leading indicator of where the market is heading — rising pending sales suggest strengthening demand, while a decline may signal cooling buyer interest before it shows up in closed data.
Median Sale Price
The midpoint of all sale prices — half sold for more, half sold for less. It's a more reliable measure than average price because it isn't skewed by extreme highs or lows, giving you a clearer picture of what typical homes are actually selling for.
Mortgage Rates
Interest rates directly impact buyer purchasing power. When rates rise, buyers can afford less home for the same monthly payment; when rates fall, demand typically increases as more buyers enter the market. Even small rate shifts can significantly affect pricing at the Fullerton Hills price points.
Recent Market Commentary
Rob Cole publishes regular market updates for the Fullerton Hills Living community — neighborhood-level insights you won't find on generic portals.