

September 28, 2026
ISSUE #07WHEN THE MARKET GOES QUIET
The market isn't broken. It's hesitating.
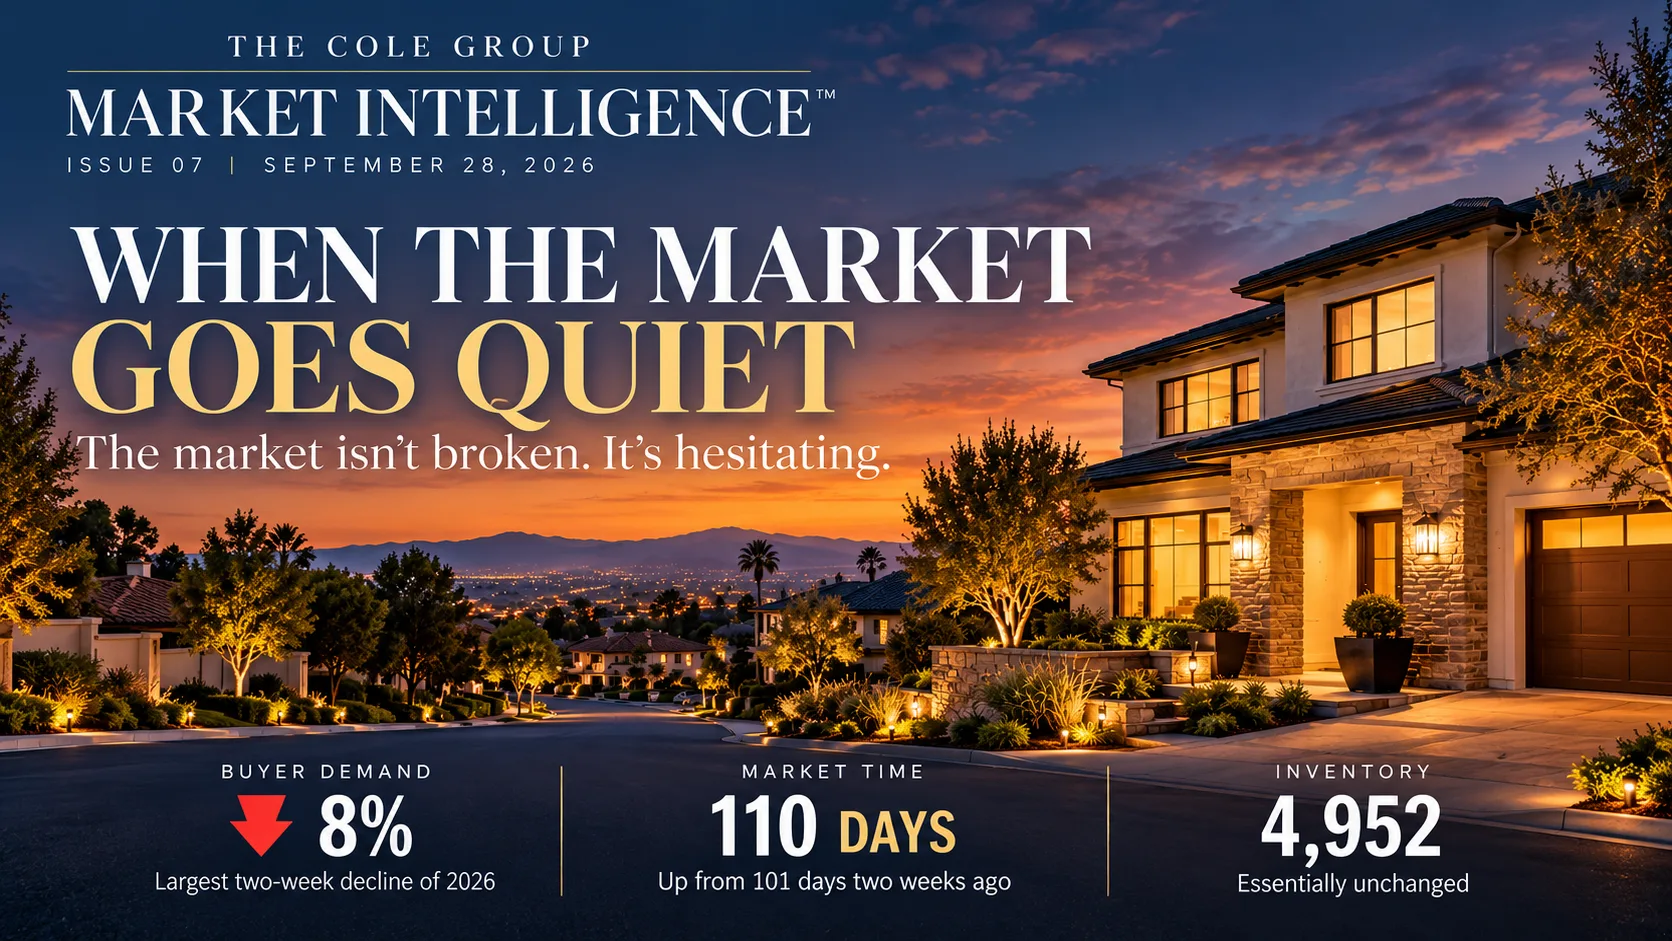
Orange County did not suddenly get flooded with homes.
Active inventory moved from 4,939 to 4,952 homes in two weeks—an increase of only 13.
Buyer demand moved in the opposite direction, falling from 1,468 to 1,349 pending sales, an 8% decline.
Expected Market Time consequently increased from 101 to 110 days.
The Market Isn't Broken. It's Hesitating.
The most important change in this report is therefore not supply. It is participation.
The market is getting quieter not because substantially more sellers suddenly showed up, but because fewer buyers are stepping forward.
And when one side of a market becomes less willing to engage, the other side is left trying to interpret the silence.
“The market isn't broken. It's hesitating.”
Four Signals We're Watching
Inventory Barely Moved
Active inventory increased by only 13 homes in two weeks—from 4,939 to 4,952.
Demand Declined 8%
Buyer demand fell from 1,468 to 1,349 pending sales.
Market Time Lengthened
Expected Market Time increased from 101 to 110 days.
Participation Is the Change
The market got quieter because fewer buyers stepped forward—not because supply surged.
Data can identify similarities. Context determines differences.
Waiting for the Market to Speak
A seller does not experience an 8% decline in countywide demand as a statistic.
They experience it through the phone that does not ring, the showing request that does not arrive, the second visit that never gets scheduled, or the offer that never materializes.
And naturally, the questions begin:
Is it the price? Is it the condition? Is it the location? Is it the presentation? Is another property attracting the buyers instead?
Those are reasonable questions. But there is an important distinction between buyers seeing a property and rejecting it—and too few buyers engaging with it to know what the market is actually saying.
“Silence is not the same thing as rejection.”
Showings create information. Feedback creates information. Offers create information.
Silence creates uncertainty.
A quiet listing still deserves attention. But before changing strategy, the better question may be:
“Do we have enough market response to know what needs changing?”
“Silence is a signal. It isn't automatically a diagnosis.”
Market Data at a Glance
Featured Orange County overview plus city-level market data from across North Orange County
Luxury Market ($2.5M+)
Orange County Market Intelligence
The numbers behind the quieter market
Active Inventory
4,952
Two weeks ago: 4,939
Buyer Demand
1,349
Two weeks ago: 1,468 · Change: -8%
Expected Market Time
110 days
Two weeks ago: 101 days · One year ago: 85 days
Attached Expected Market Time
128 days
Detached Expected Market Time
99 days
Pre-COVID Three-Year Average Inventory
~6,400 homes
Inventory barely moved. Buyer demand did.
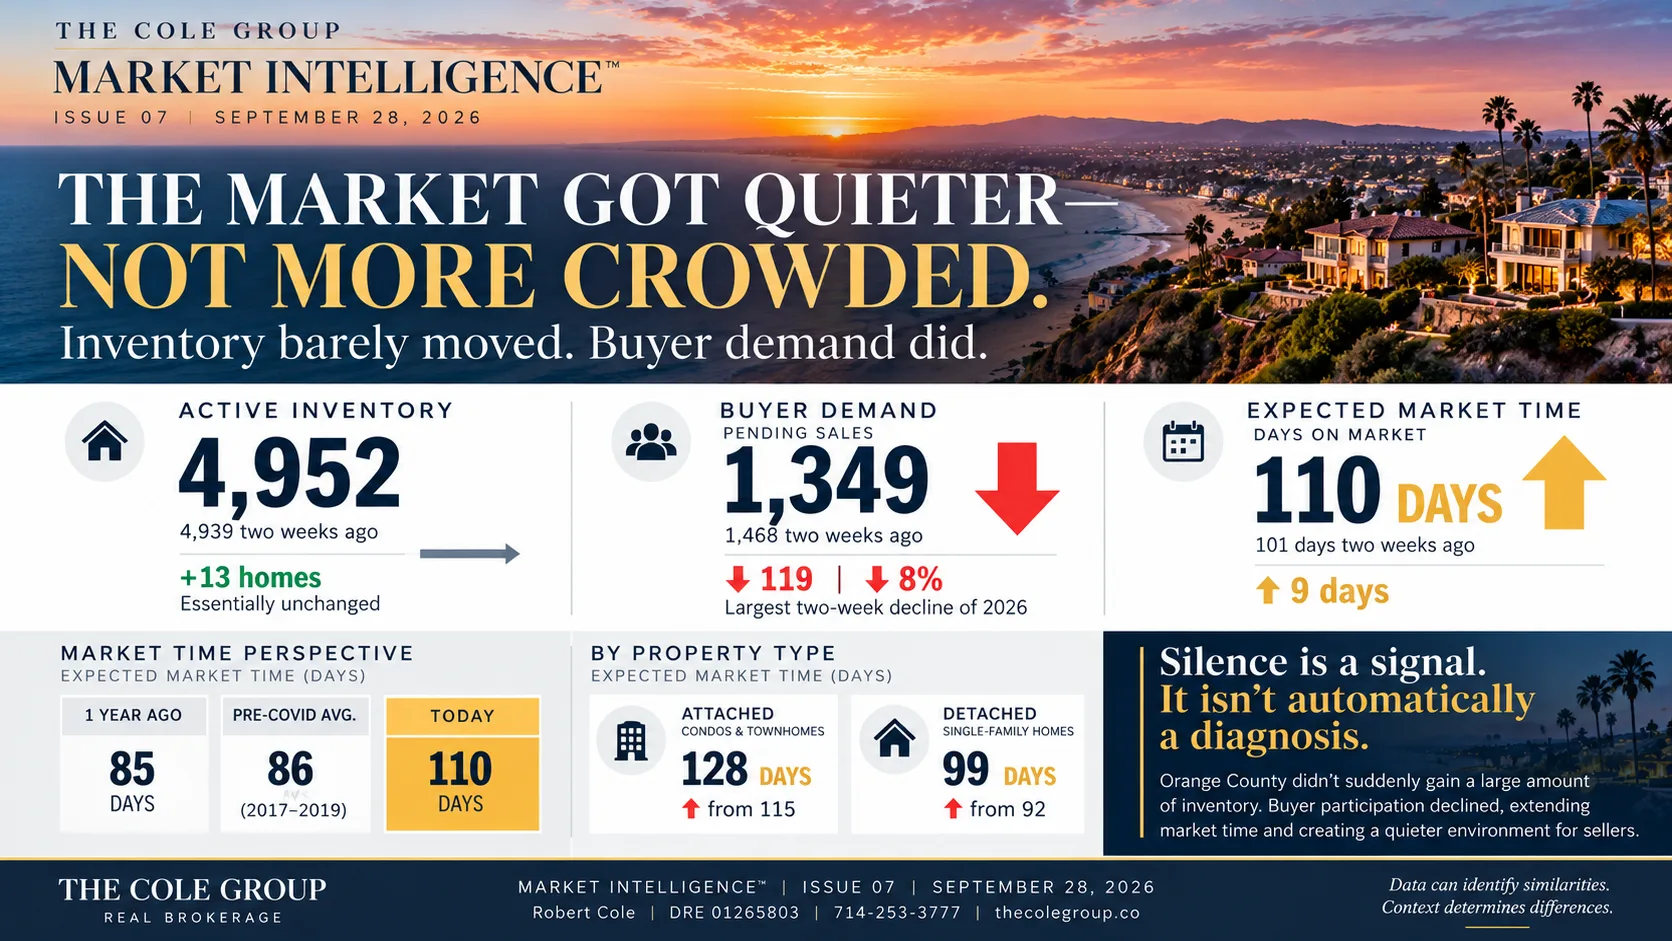
Active inventory stood at 4,939 homes two weeks ago and now measures 4,952—an increase of only 13 homes. Buyer demand, by comparison, fell 8%, from 1,468 to 1,349 pending sales.
Expected Market Time therefore lengthened from 101 to 110 days countywide, compared with 85 days one year ago.
Property type continues to separate the market: attached homes carry a 128-day Expected Market Time while detached homes move in 99 days.
And even at 4,952, today's inventory remains well below the approximately 6,400-home pre-COVID three-year average.
The market didn't suddenly get more crowded. It got quieter.
The Buyers Didn't Disappear
But fewer are stepping forward.
Orange County still measured 1,349 pending sales. Buyers have not disappeared, but fewer are moving from interest to action.
Sellers and buyers experience that differently.
Once a seller lists, the seller has committed to the process. The buyer can continue watching, comparing, calculating, waiting—or decide not to act yet.
“Sellers are committed. Buyers can hesitate.”
“For the seller, quiet can create urgency. For the buyer, quiet can create optionality.”
“You can't negotiate until someone is willing to engage.”
The seller's challenge in a quieter market is therefore not simply negotiating with a difficult buyer. It can be getting enough buyers into the conversation to understand what the market is saying.
“Don't confuse insufficient evidence with negative evidence.”
Then and Now — 2008 vs. Today
Why a slower market does not automatically mean another 2008-style crash
A slower market does not automatically mean another 2008-style housing crash.
| Period | Orange County Inventory |
|---|---|
| 2006 | approximately 16,000 |
| 2007 | nearly 18,000 |
| Current | 4,952 |
| Year | Distressed Closings |
|---|---|
| 2007 | 1,521 |
| 2008 | 10,244 |
| 2009 | 13,008 |
| 2025 | 41 |
| Through August 2026 | 25 |
Current active distressed listings: 13.
99.72% of August closed sales involved sellers with equity.
The source report identifies three ingredients associated with a housing crash: excessive supply, weak demand and sellers who must sell.
Weak demand exists today. The other two conditions do not currently resemble the Great Recession environment described in the report.
“Markets can feel similar without being fundamentally the same.”
One County. Different Conversations.
The countywide slowdown is real—but it isn't unfolding the same way in every local market or price segment.
Does the slowdown look the same in every city?
No—local markets are having different conversations.
| Market | Active | Demand | Expected Market Time | 2 Weeks Ago | 1 Year Ago |
|---|---|---|---|---|---|
| Orange County | 4,952 | 1,349 | 110 days | 101 | 85 |
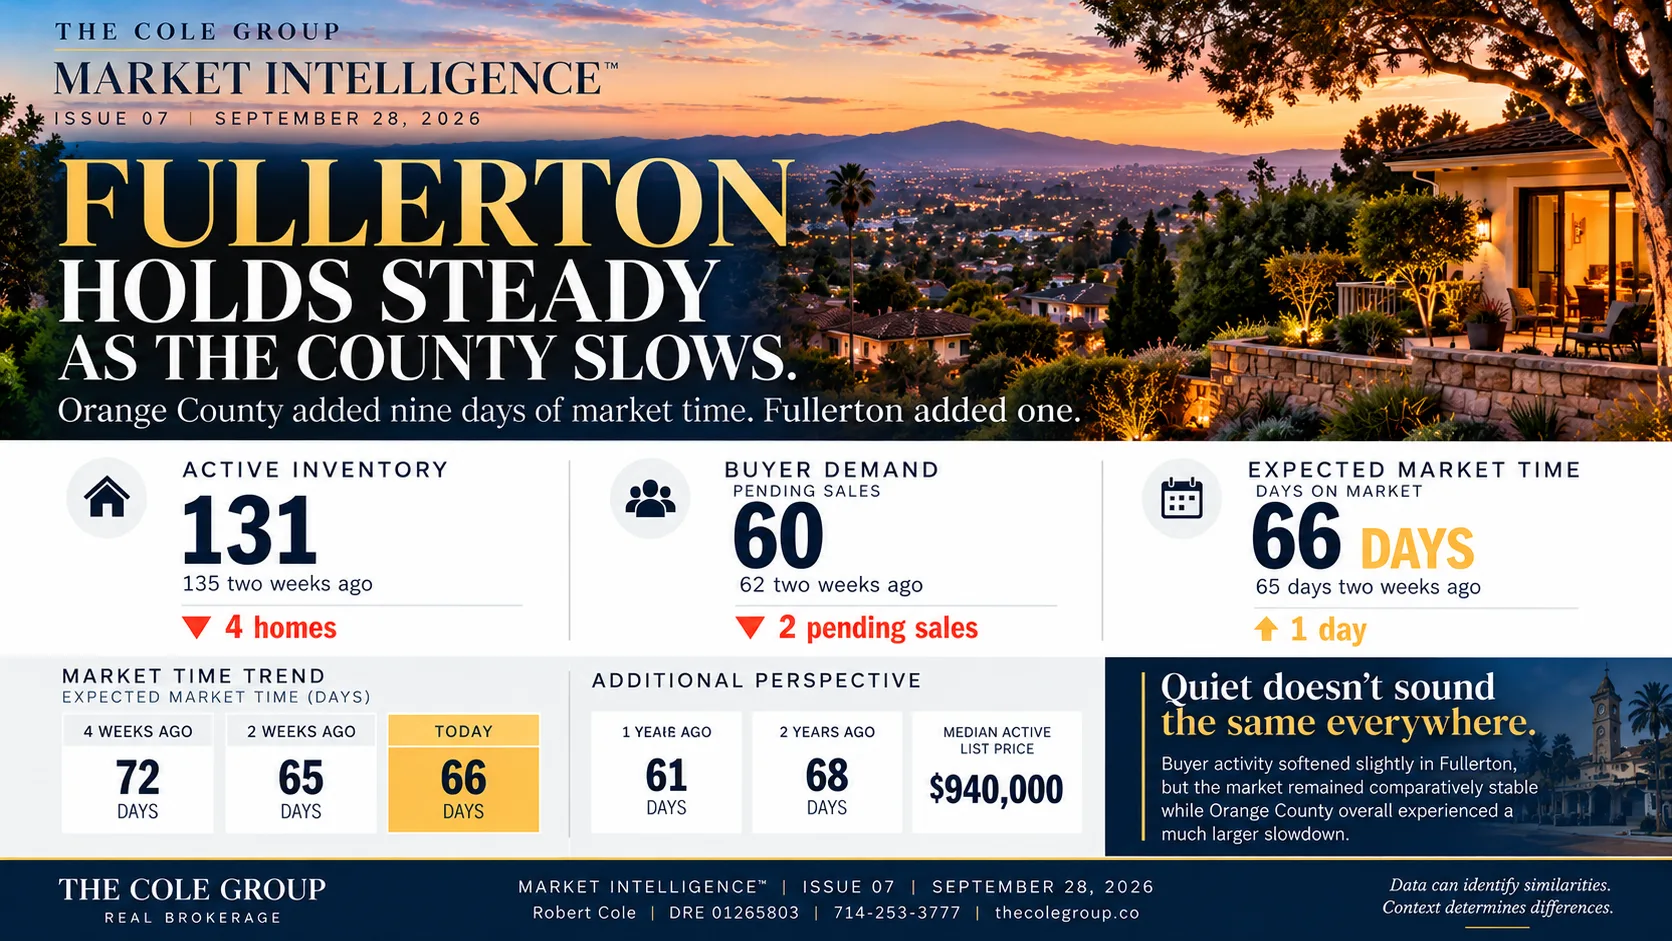
| Fullerton | 131 | 60 | 66 days | 65 | 61 |
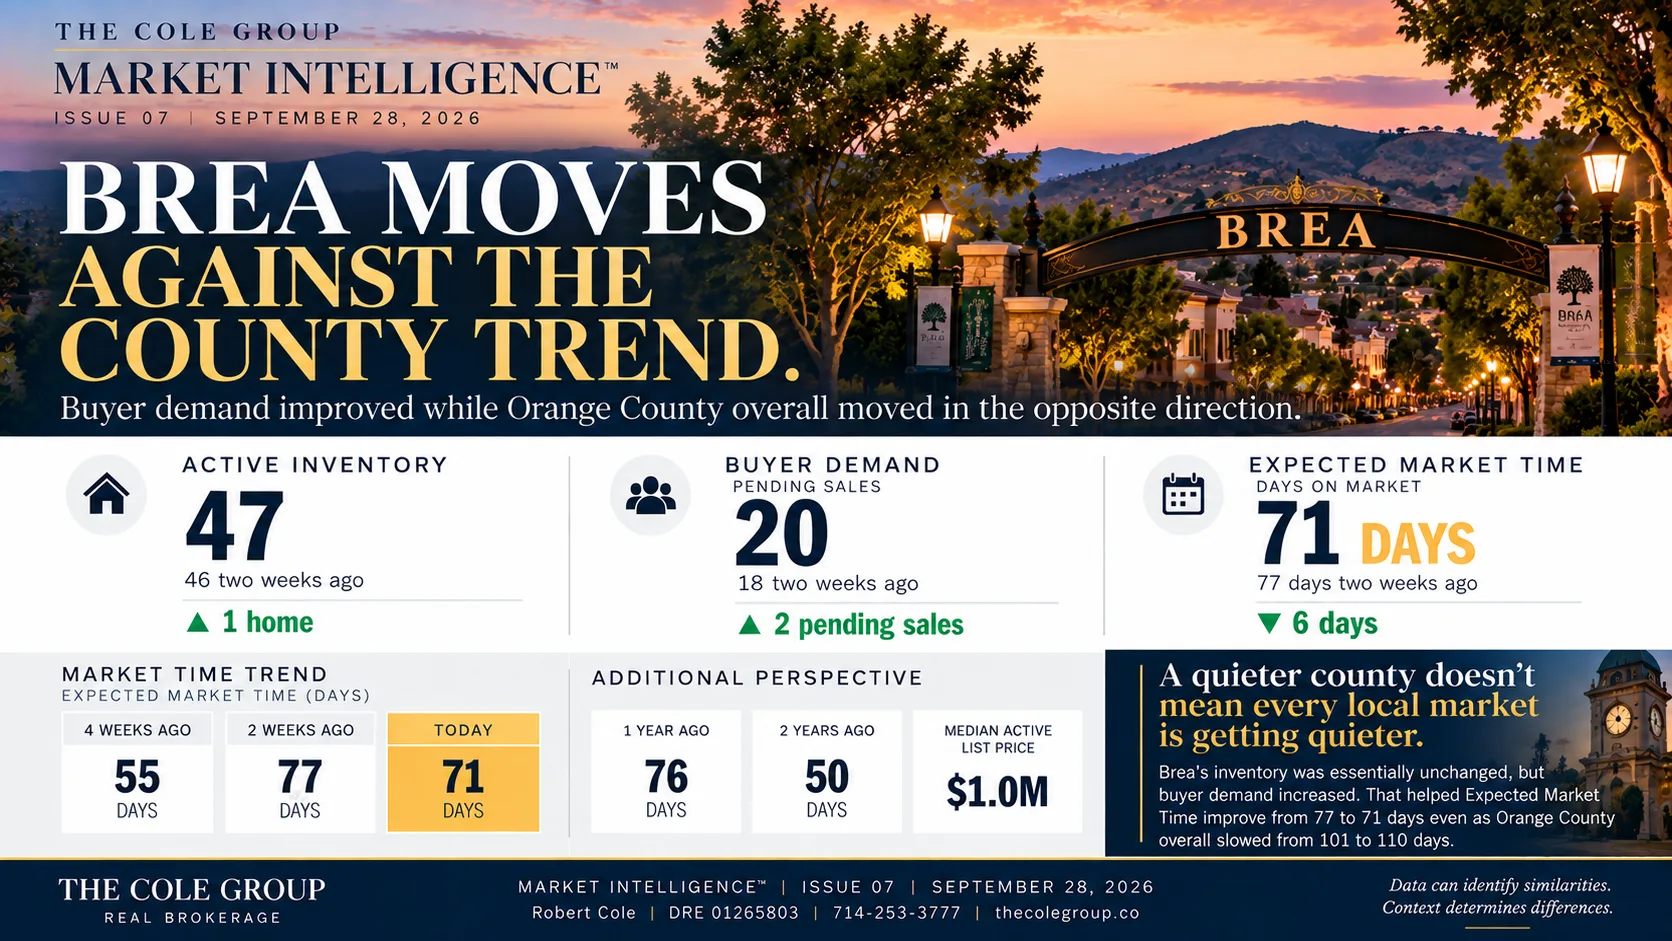
| Brea | 47 | 20 | 71 days | 77 | 76 |
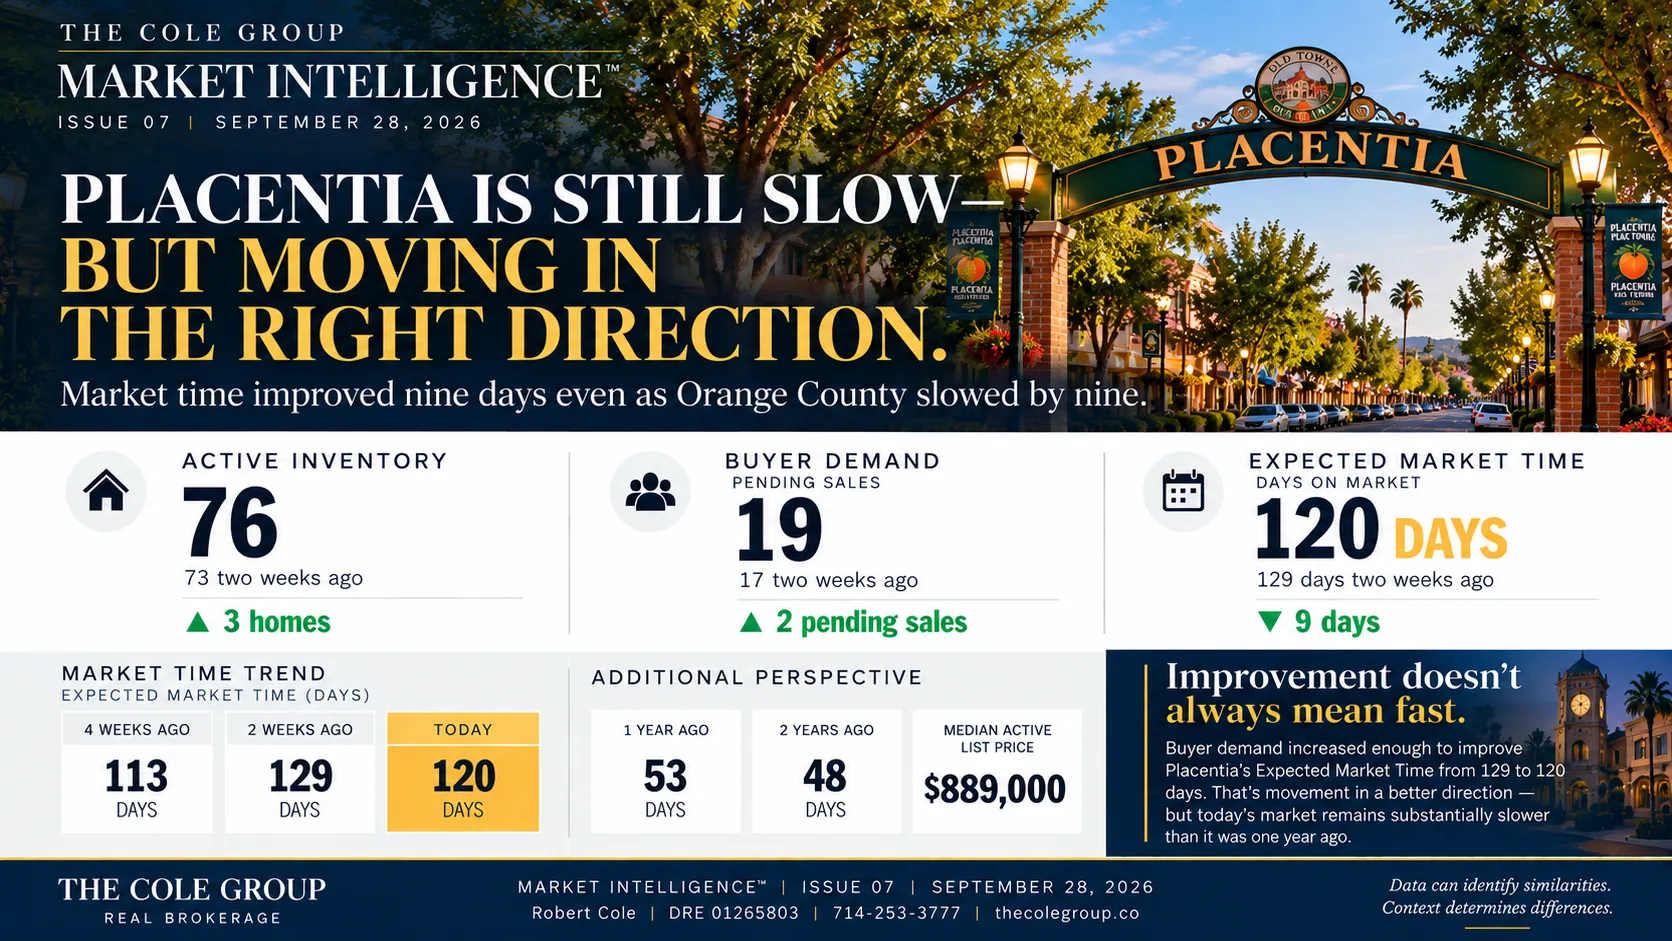
| Placentia | 76 | 19 | 120 days | 129 | 53 |
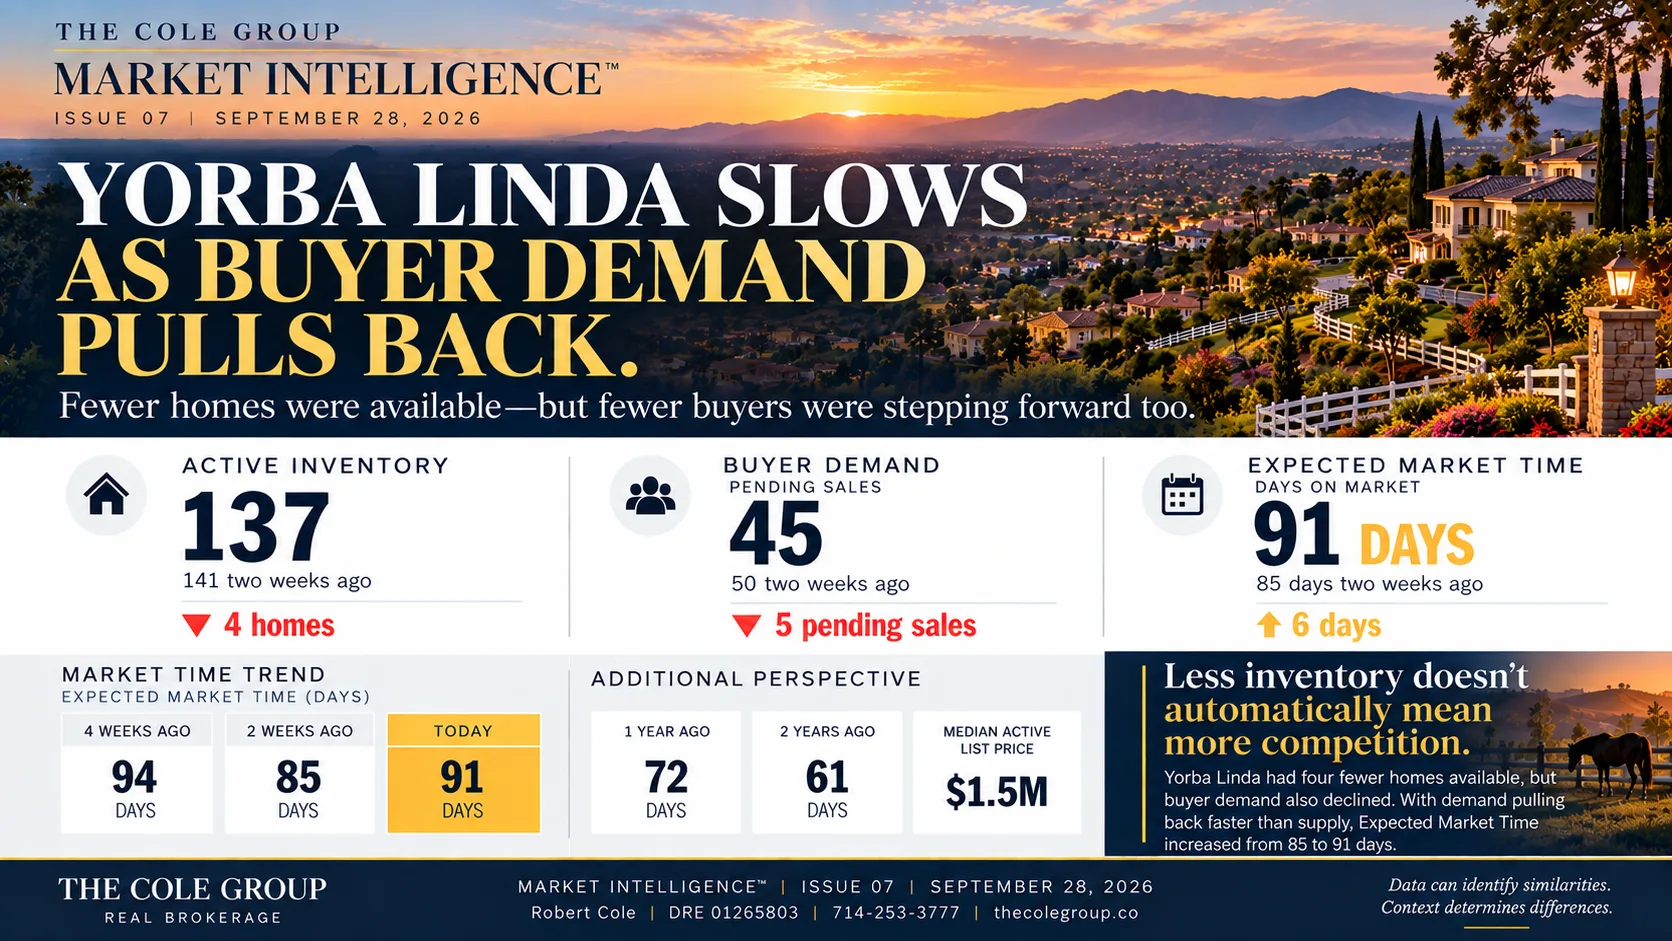
| Yorba Linda | 137 | 45 | 91 days | 85 | 72 |
The countywide slowdown is real—but it isn't unfolding the same way in every local market or price segment.
Fullerton — Comparatively Stable
Fullerton's 131 active listings and 60 in demand produce a 66-day Expected Market Time, down slightly from the 71-day pace two weeks ago and the 85-day countywide average.
Fullerton remained comparatively stable while Orange County slowed.
Brea — Direction Matters
Brea has 47 active listings, 20 in demand and a 71-day Expected Market Time.
Brea moved against the countywide trend as demand improved and market time declined.
Placentia — Still Slow, But Better
Placentia has 76 active listings and 19 in demand, producing a 120-day Expected Market Time.
Placentia remains slow, but moved in a better direction during the latest period.
Yorba Linda — A Different Combination
Yorba Linda's 137 active listings and 45 in demand produce a 91-day Expected Market Time.
Inventory declined, but demand also declined, causing market time to increase.
What These Five Markets Tell Us
Same county. Same broad economic backdrop. Different conversations.
Orange County establishes the environment. The city narrows the competitive field. The neighborhood narrows it further. The individual property determines the actual strategic position.
Luxury Market Intelligence
When Luxury Gets Quiet
Orange County homes priced above $2.5 million
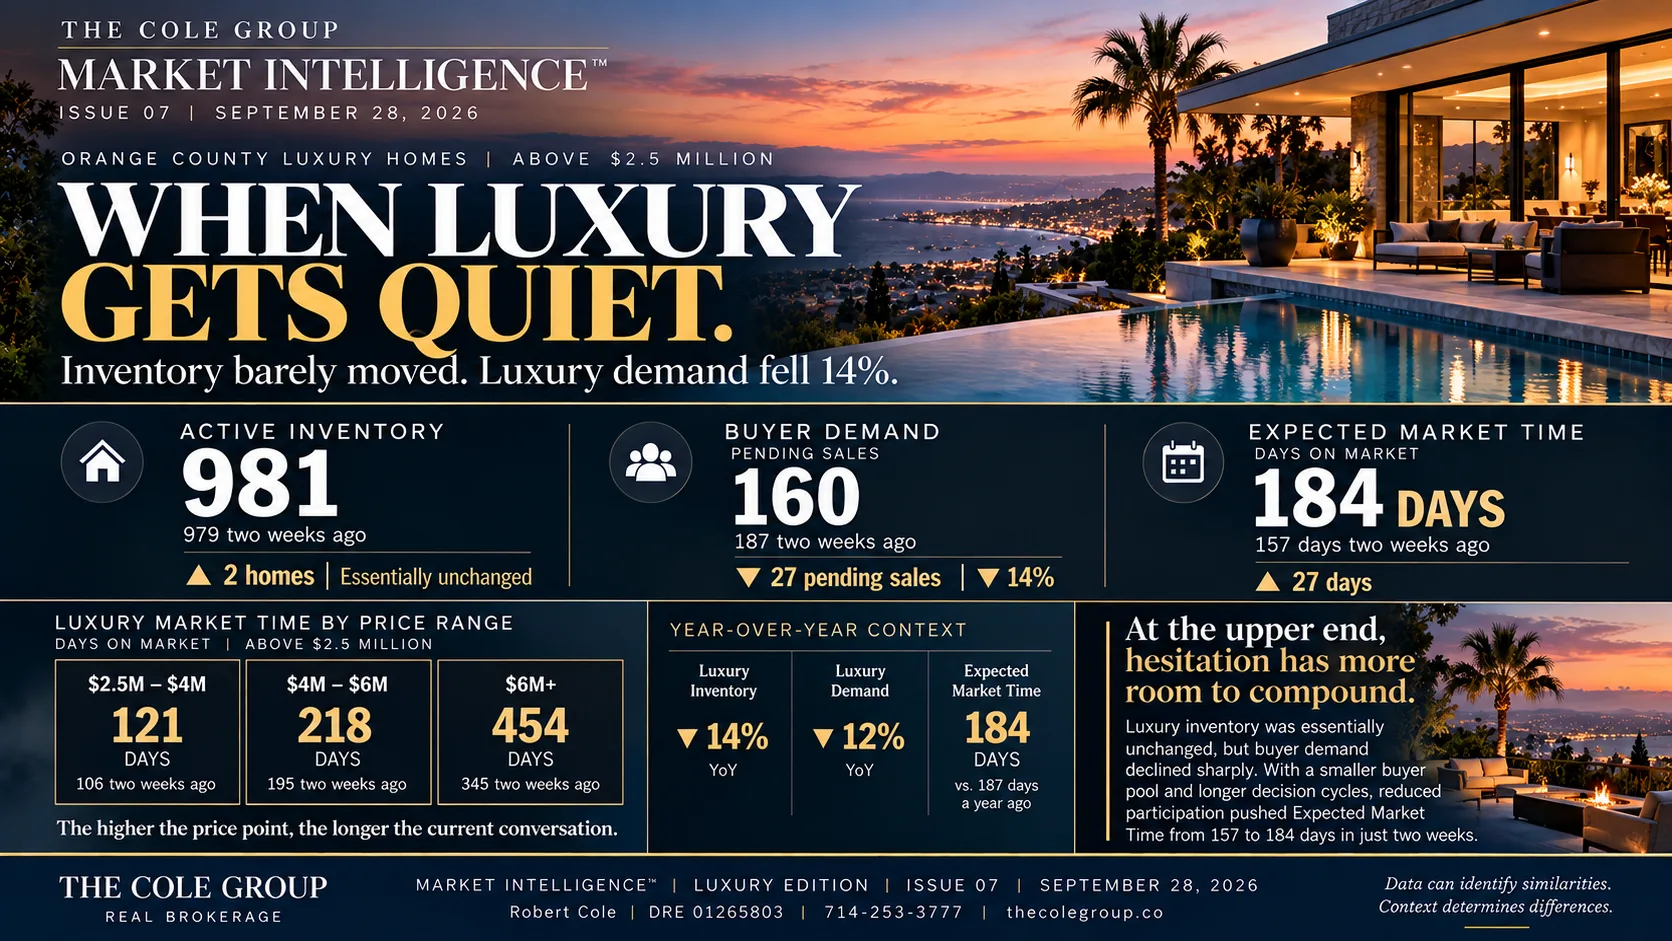
Luxury is defined as Orange County homes priced above $2.5 million.
Orange County currently has 981 active luxury listings and 160 in demand, producing a 184-day Expected Market Time.
Two weeks ago, the luxury market measured 979 active listings, 187 in demand and a 157-day Expected Market Time.
Demand declined 14%.
Luxury Market Time by Price Tier
The higher the price point, the thinner the buyer pool—and the longer quiet periods can last.
| Luxury Price Range | Expected Market Time |
|---|---|
| $2.5M–$4M | 121 days |
| $4M–$6M | 218 days |
| $6M+ | 454 days |
A $2.8 million property and a $7 million estate may both be called luxury, but they're not operating in equivalent markets.
At higher price points, buyer pools narrow and properties become less interchangeable. Longer exposure can therefore be part of the normal transaction cycle rather than evidence by itself that something is wrong.
At the upper end, hesitation has more room to compound.
Monthly Sold Report
What Actually Happened at the Closing Table?
July 2026 — Latest finalized Orange County closed-sales report
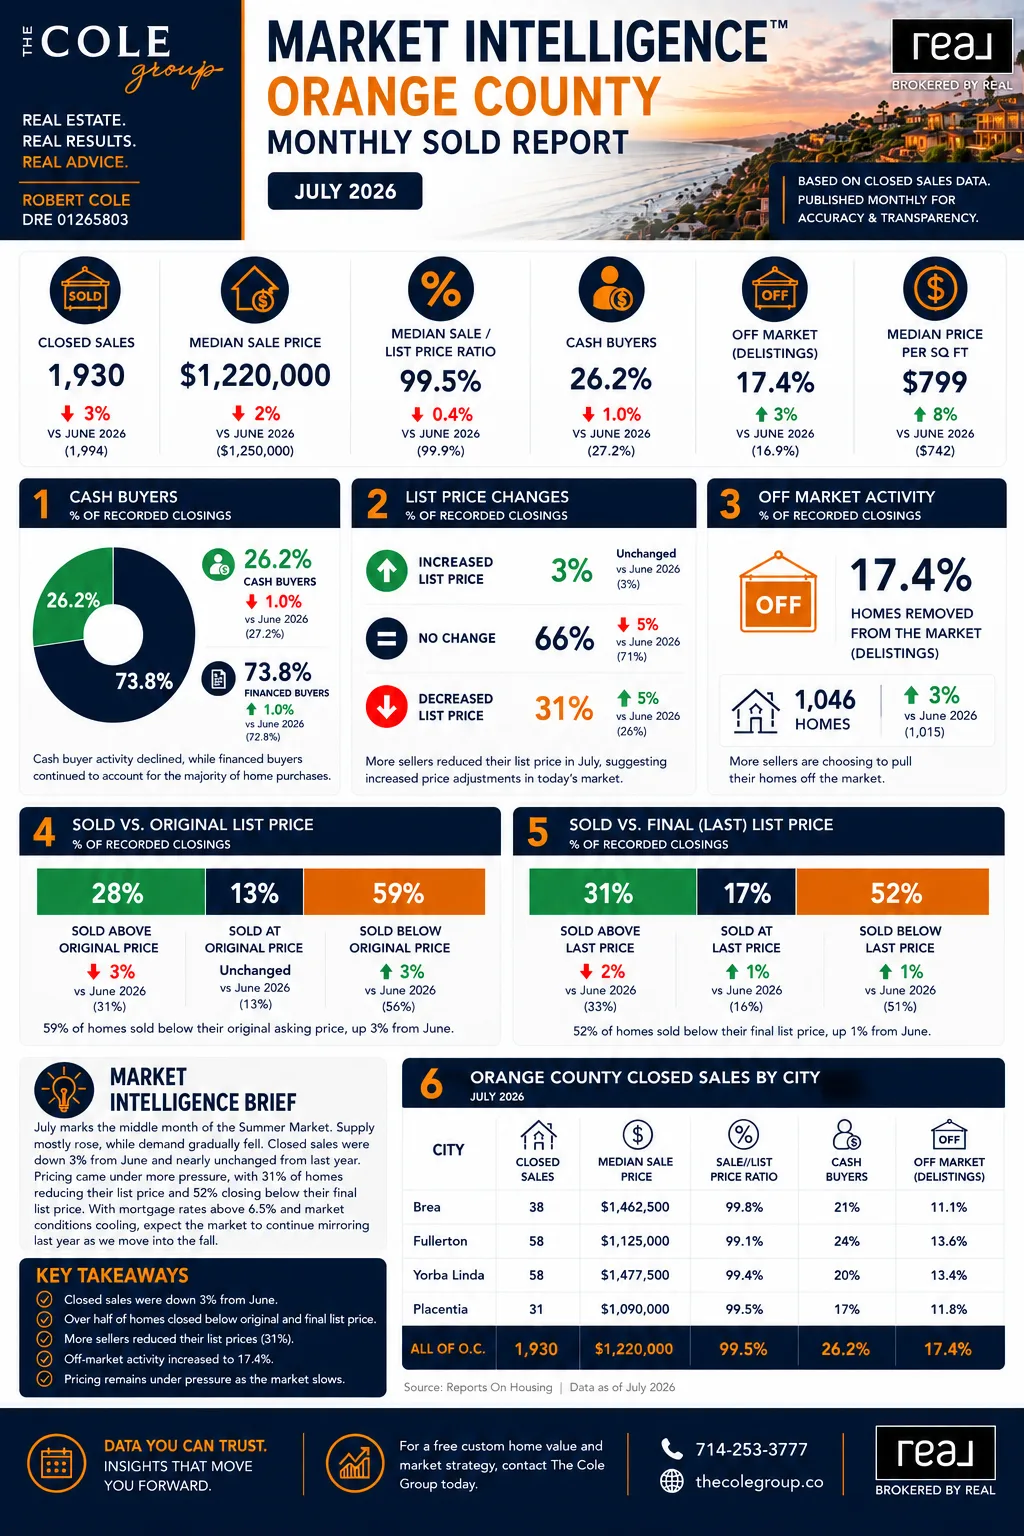
Current Market Intelligence helps us understand where conditions are developing. The Monthly Sold Report gives us another perspective: how completed transactions actually finished.
The current Monthly Sold Report covers July 2026 and intentionally operates on a different publication cycle from the September 14 biweekly report.
Orange County recorded 1,930 closed residential sales, with a $1.22 million median sale price and 99.5% sale-to-list ratio.
Sold vs. Final Asking Price
- 31% sold above final asking.
- 17% sold at final asking.
- 52% sold below final asking.
The newer August closing data shows almost exactly the same pattern:
- July: 52% below / 48% at or above.
- August: 52% below / 48% at or above.
For two consecutive closing periods, roughly half of transactions finished below final asking—while nearly half still finished at or above it.
The market is creating negotiation. It is not producing the same outcome on every property.
What the Sold Report Adds to the Playbook
Asking price is a position. The market response tells us how strong that position is.
Closed-sales data shows where previous buyers and sellers ultimately found agreement. The next transaction still begins with the individual property—not the countywide average.
When a Quiet Market Becomes a Property-Level Question
Raymond Hills, Sunny Hills, Golden Hills and the surrounding Fullerton Hills neighborhoods cannot be accurately diagnosed from a countywide 110-day Expected Market Time alone.
Individual properties compete within different price ranges, streets, views, lot characteristics, condition levels, school influences, architectural styles and buyer pools.
A quieter countywide market establishes context. The response to the individual property provides the next layer of evidence.
“Hesitation describes the market. Response diagnoses the property.”
Orange County Housing Market Answer Center
Is the Orange County housing market slowing?
Yes. Expected Market Time increased from 101 to 110 days as buyer demand declined 8% while inventory remained essentially unchanged.
Why is the Orange County housing market slowing if inventory isn't rising much?
The latest report shows the larger change occurred in buyer demand rather than inventory. Active inventory increased by only 13 homes while demand declined by 119 pending sales.
Does a slower Orange County housing market mean another 2008-style crash is beginning?
The current market shares some surface-level characteristics with slower historical markets, but inventory, homeowner equity and distressed-sale conditions differ substantially from the Great Recession environment documented in the report.
Does receiving no offer automatically mean a home is overpriced?
No. A lack of offers is one market result. Showing volume, buyer feedback, competing inventory and property-specific response provide additional evidence needed to understand why.
Have Orange County buyers disappeared?
No. The report measured 1,349 pending sales. Buyer demand has declined, meaning fewer buyers are currently moving forward.
Are all Orange County cities slowing at the same rate?
No. Fullerton remained comparatively stable, Brea and Placentia improved during the latest period, while Yorba Linda slowed.
What This Means for You
SELLERS
Do not ignore silence—but do not rush to explain it either. Track showing volume, feedback, repeat visits, competing inventory and buyer behavior before deciding what the market is telling you.
BUYERS
A slower environment can create additional time and negotiating opportunities, but not every property or city is equally negotiable. Local conditions and property-specific demand still matter.
HOMEOWNERS
A countywide Expected Market Time of 110 days does not mean every property has lost a particular percentage of value. Market time, demand and property value are related, but they are not interchangeable measurements.
The Market Isn't Broken. It's Hesitating.
Quiet markets leave more room for assumptions.
A seller can interpret silence as rejection. A buyer can interpret a slower market as automatic leverage.
Neither conclusion should be automatic.
The task is to determine what kind of slowdown we are looking at—and whether the evidence is coming from the broader market, the individual property, or both.
“The market can tell you a lot about a property—but first, you need enough of the market to show up.”
“The market isn't broken. It's hesitating.”
Data can identify similarities. Context determines differences.
Questions about how this applies to your home? Let's talk.
Past Publications
Previously featured issues. Still accessible and searchable below.

The Market Has a Playbook
Read Report
The Season of Selectivity
Read Report
Beyond the Algorithm
Read Report
A Tale of Two Markets
Read Report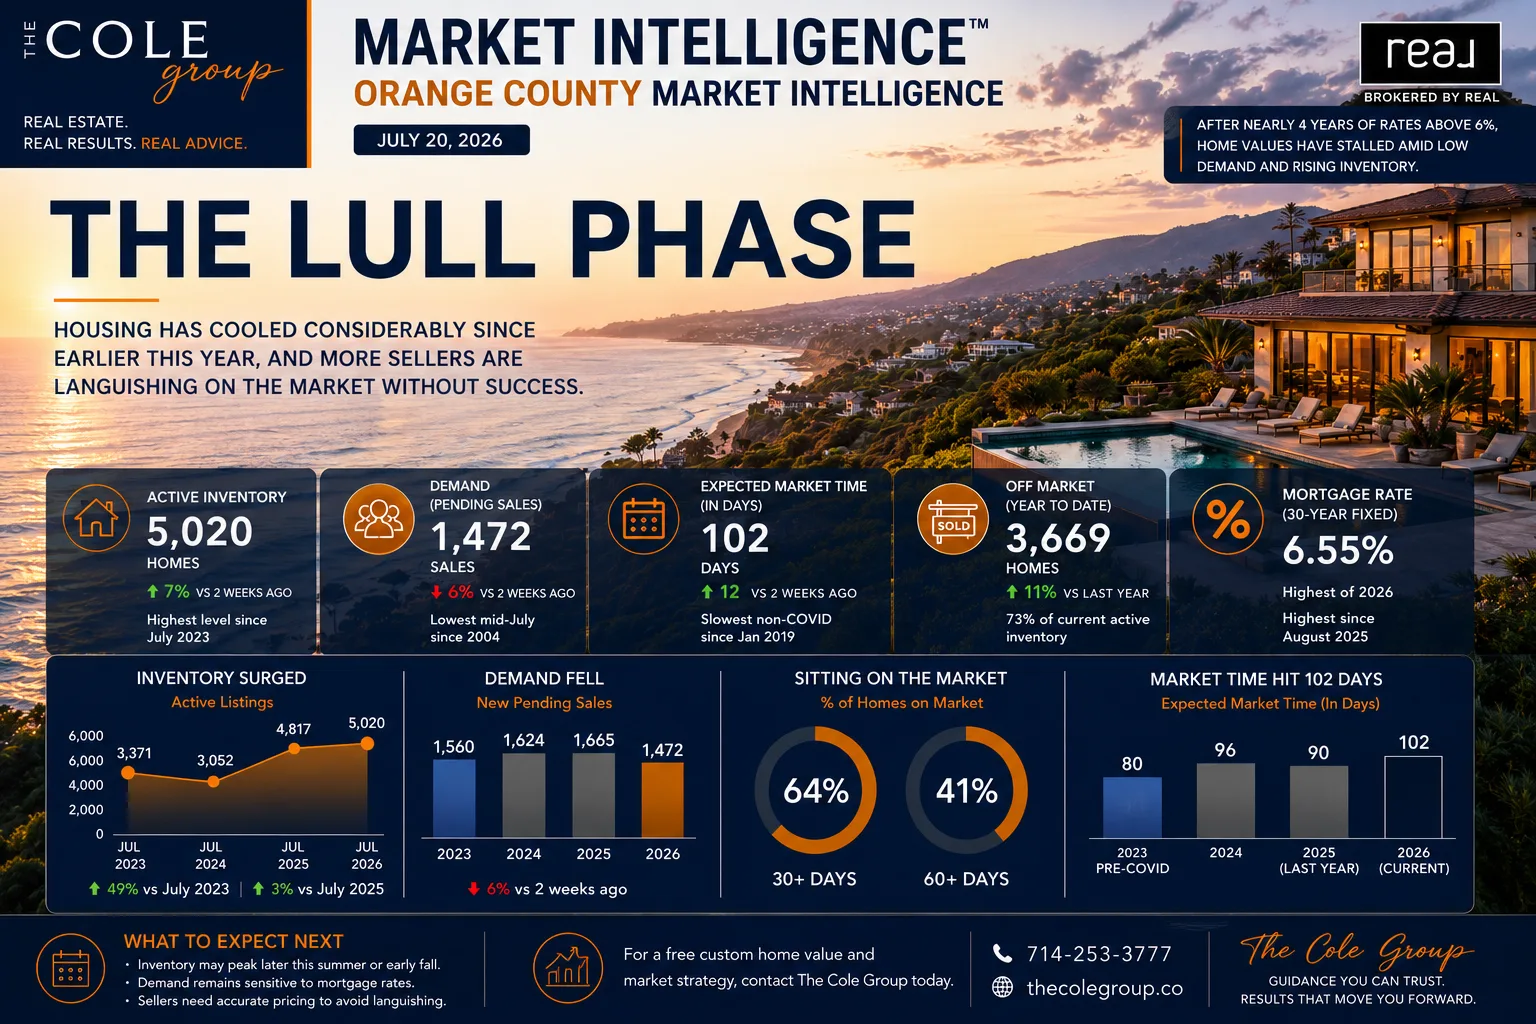
The Lull Phase
Read Report
A Market in Transition
Read ReportWhat Is Your Home Worth in This Market?
Countywide statistics establish context. Understanding what they mean for an individual property requires a closer look at the property's market response, competition and circumstances.
Rob Cole, Senior Broker Associate | The Cole Group at REAL Broker | DRE# 01265803
Based on information from California Regional Multiple Listing Service, Inc. as of 2026 and/or other resources. All data, including all measurements and calculations of area, is obtained from various sources and has not been, and will not be, verified by broker of MLS. All information should be independently reviewed and verified for accuracy. Properties may or may not be listed by the office/agent presenting the information. The information being provided is for consumer's personal, non-commercial use and may not be used for any purpose other than to identify prospective properties consumers may be interested in purchasing.